Every Spectral indicator, with its source.
Each indicator is one JavaScript file in Spectral's custom indicator format. Open one to read how it works, then copy or download the file, add it in the Indicators toolbox, and change it however you like. Every file is MIT-0: free to use, change and share.
- Indicators
- 94
- 01
Pick an indicator and open it for the settings, the outputs and the full source.
- 02
Copy or download the file, and change it if you want.
- 03
Add it in Spectral: Indicators → Custom indicators → Add file… How to install
Describe it. An LLM writes it.
Copy the ready-made prompt, add one sentence about what your indicator should do, and paste it into any LLM. The prompt already gives the LLM everything else, so all you write is the description.
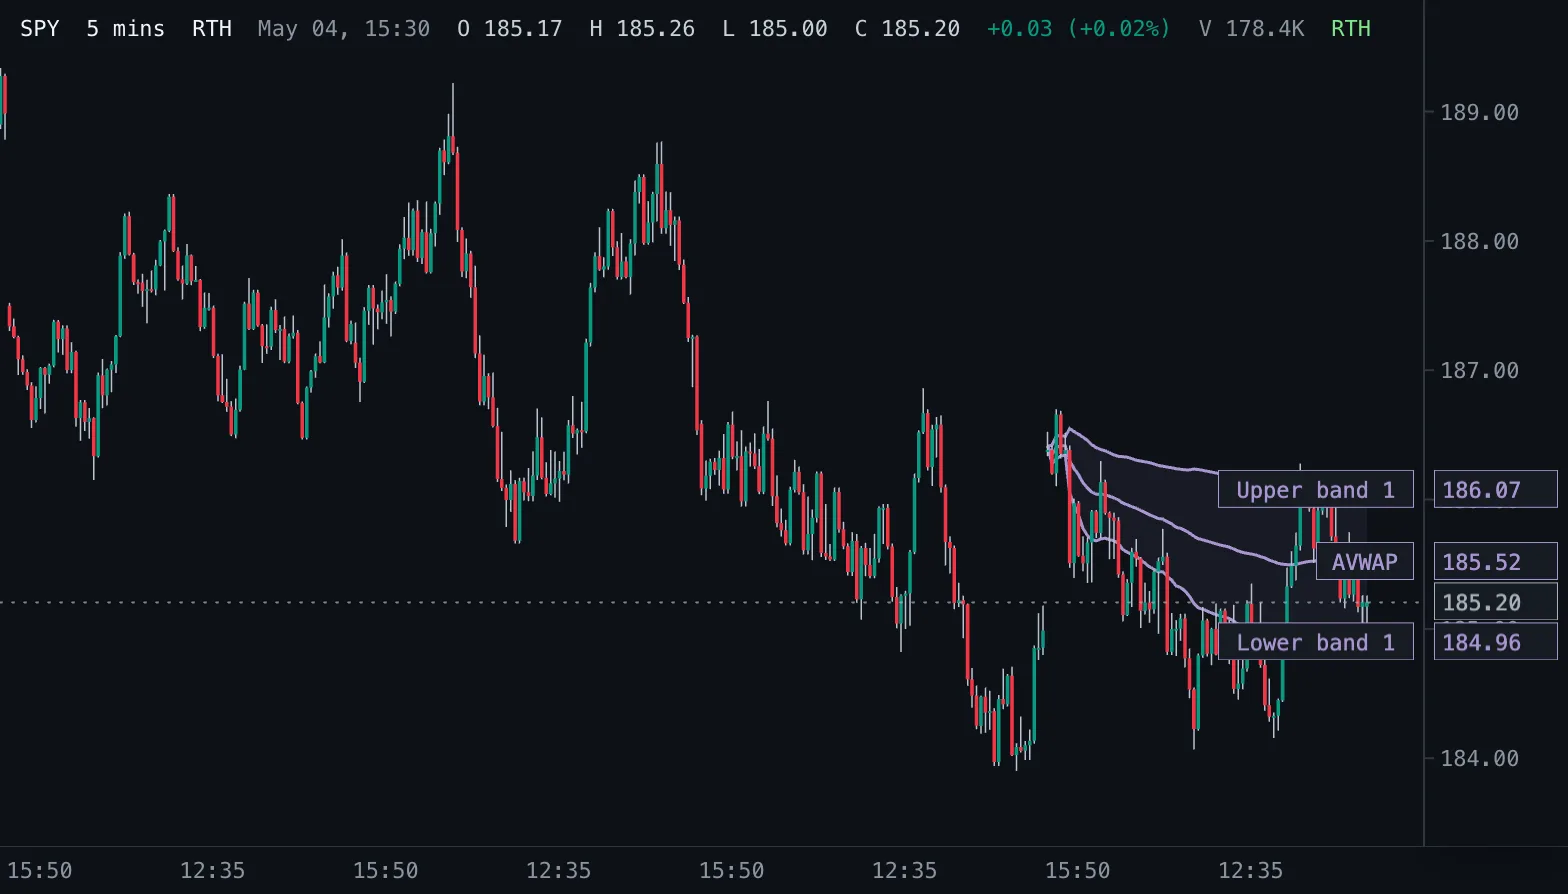
Anchored VWAP AVWAP
Volume-weighted average price counted from a chosen start time, with optional volume-weighted standard deviation bands.
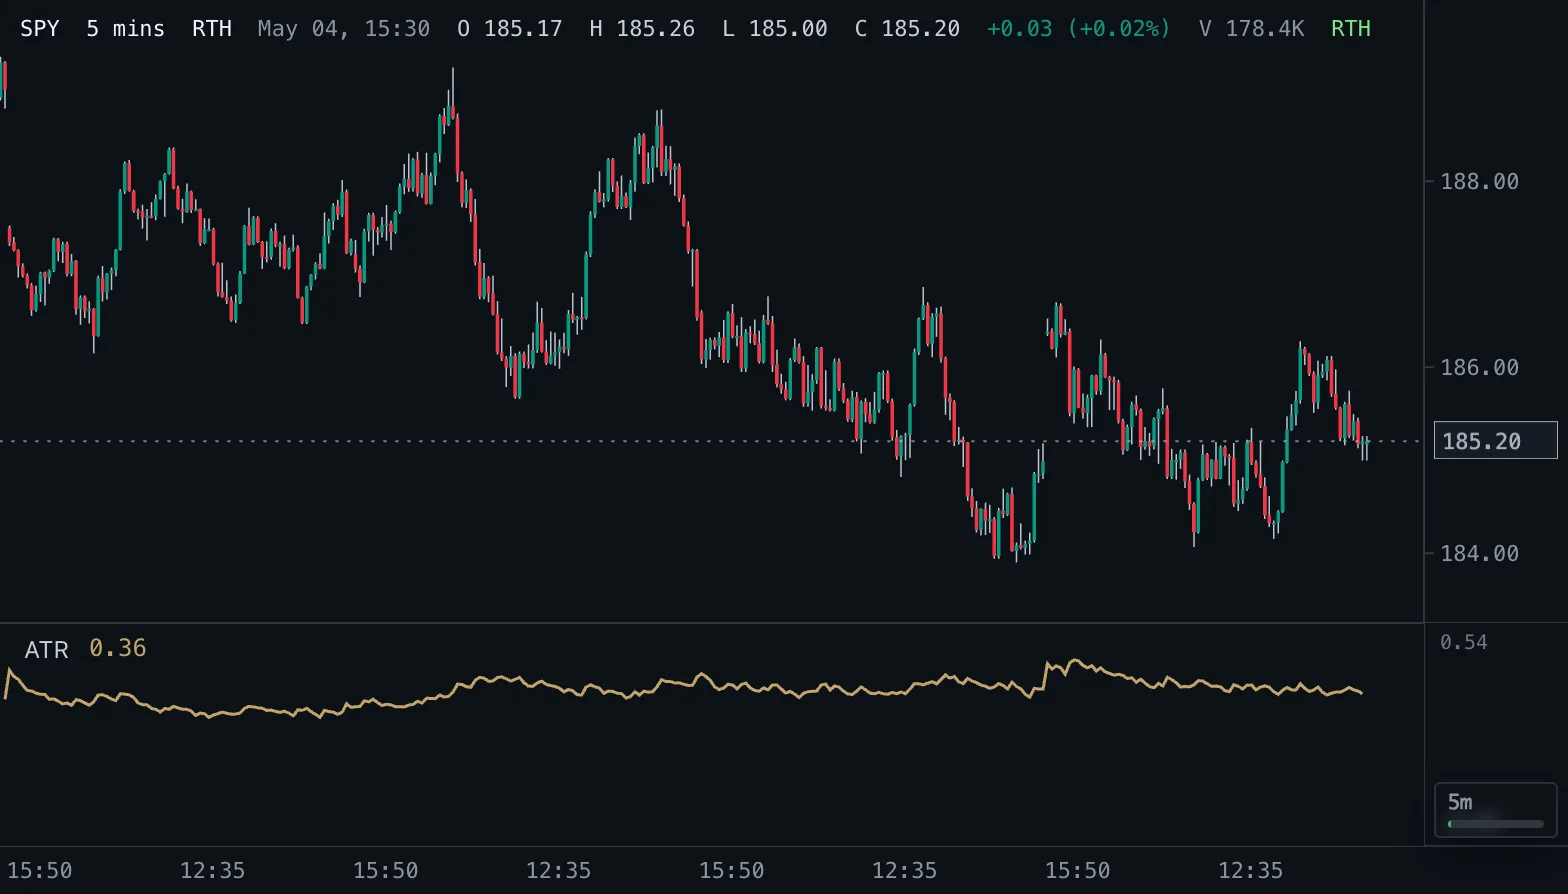
Average True Range ATR
Average True Range: the average size of a bar including gaps, in price units, with Wilder smoothing by default.
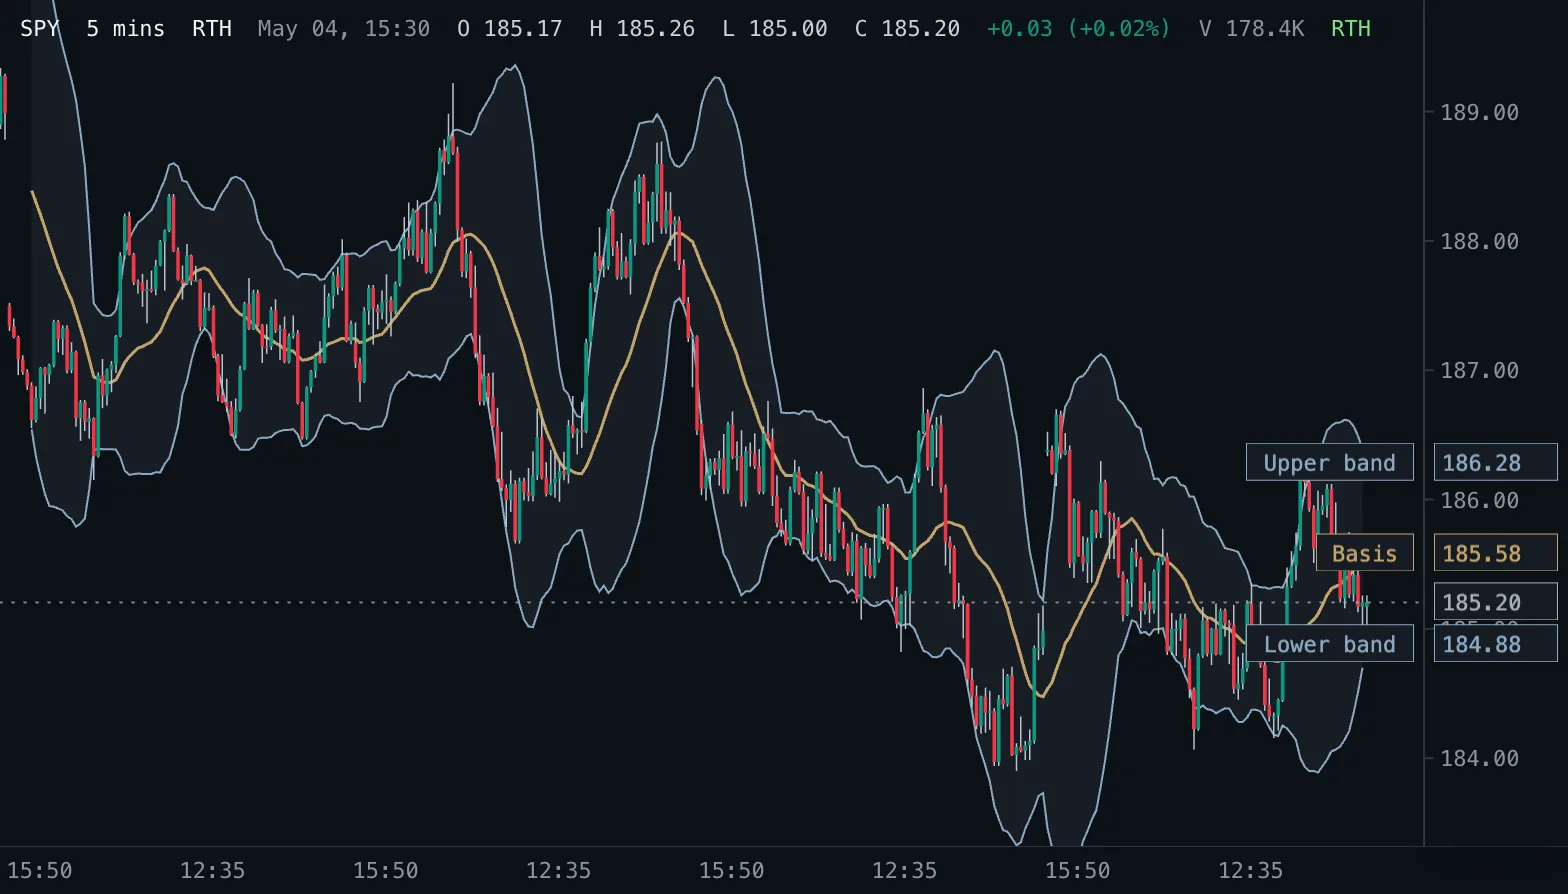
Bollinger Bands BB
A moving average with bands a chosen number of standard deviations above and below it, so the band width follows volatility.
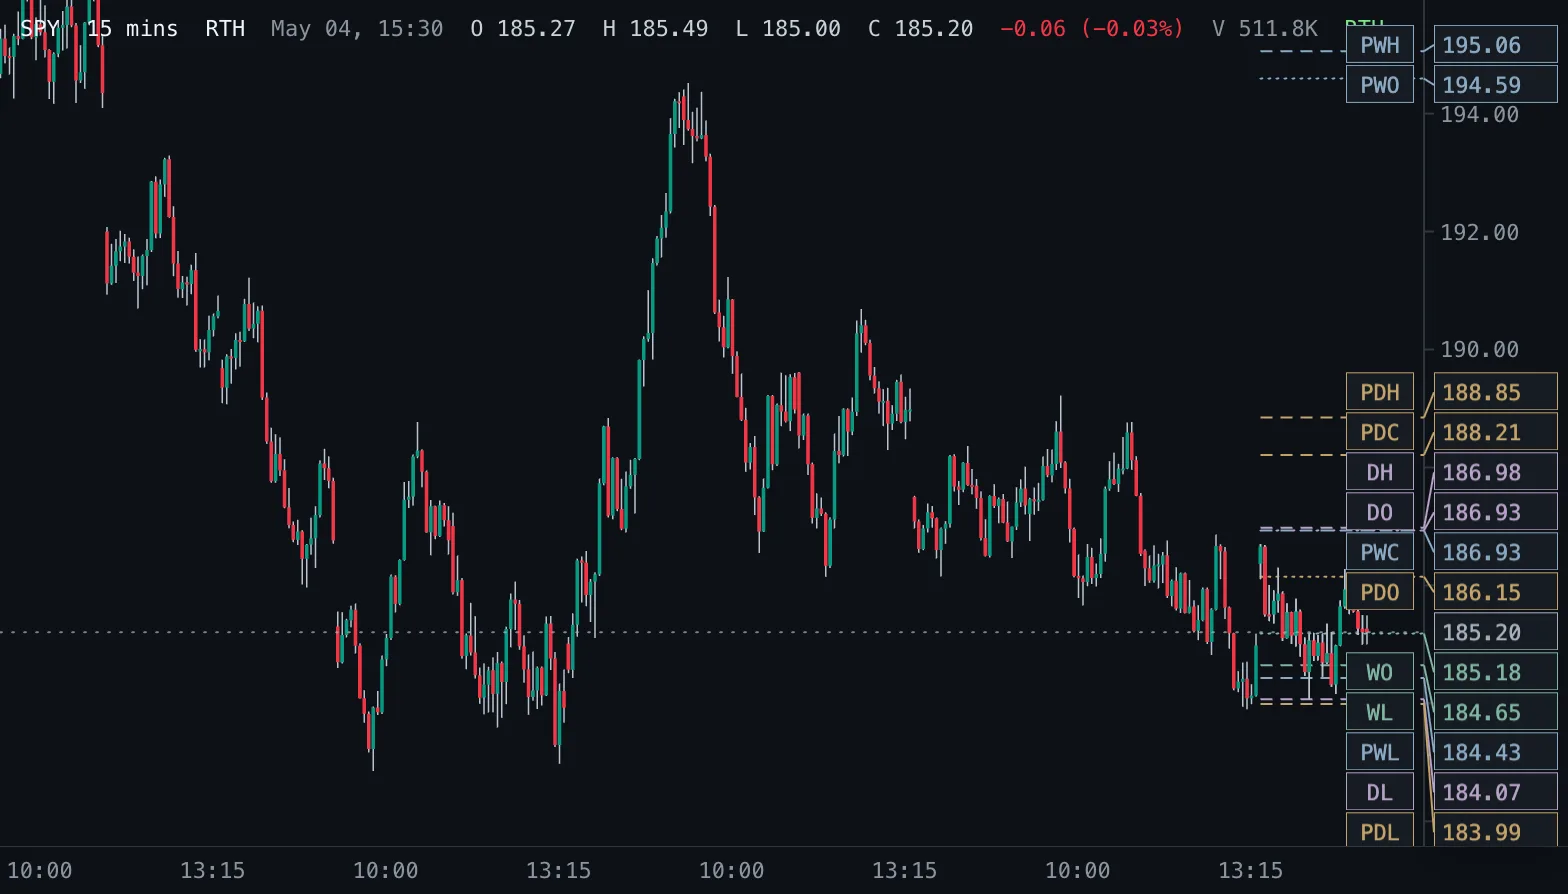
Daily & Weekly Levels D/W Levels
Previous and current day and week open, high, low and close as levels, read from real daily and weekly bars.
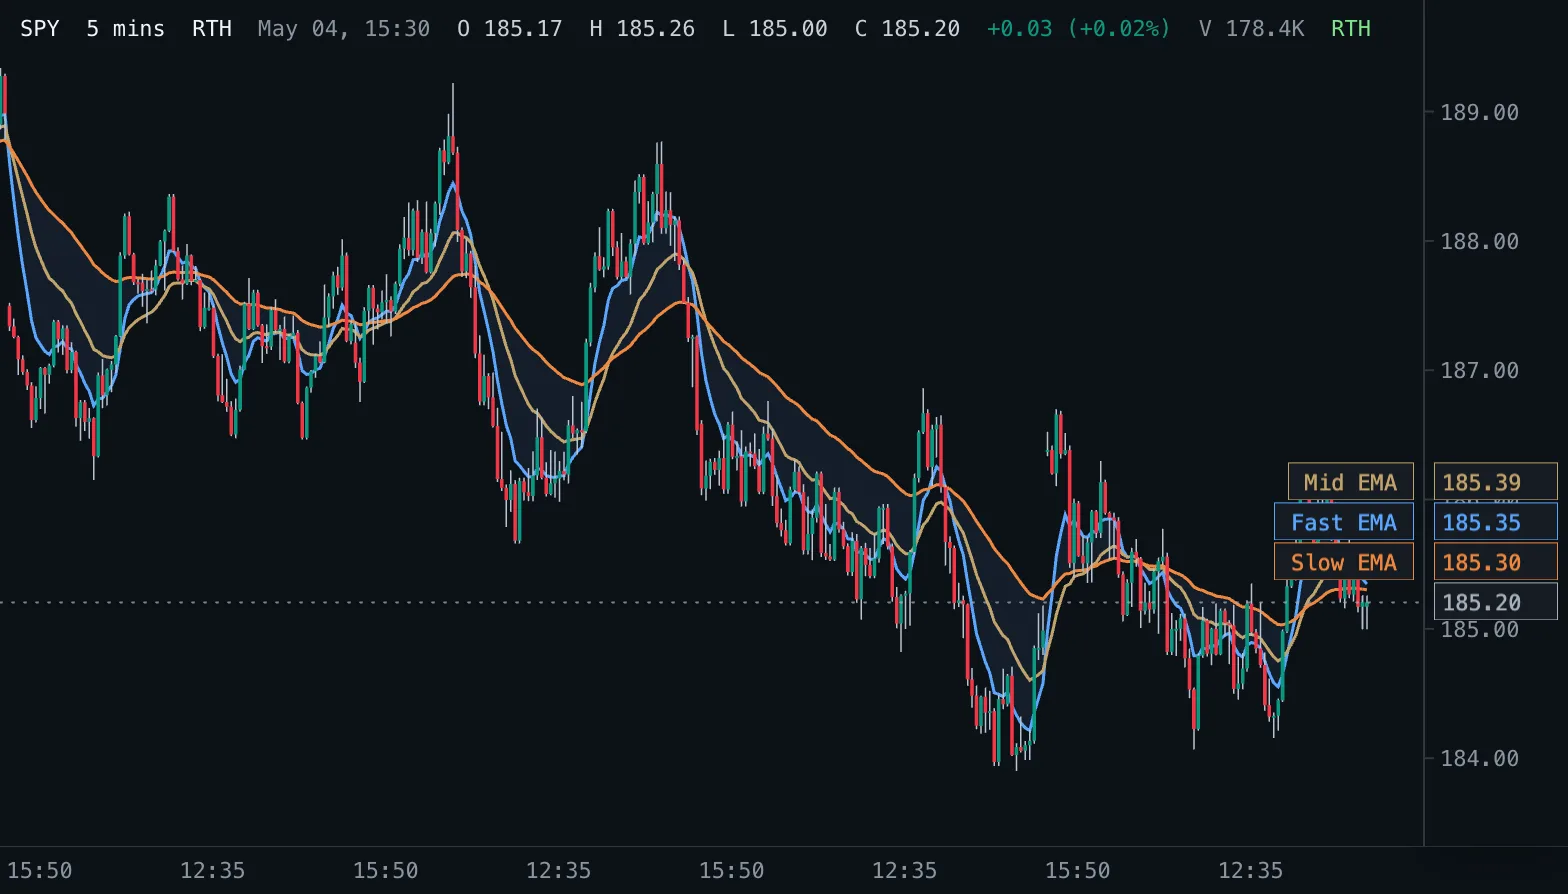
EMA Ribbon Ribbon
Three exponential moving averages on the price pane with a shaded band between the fastest and the slowest.
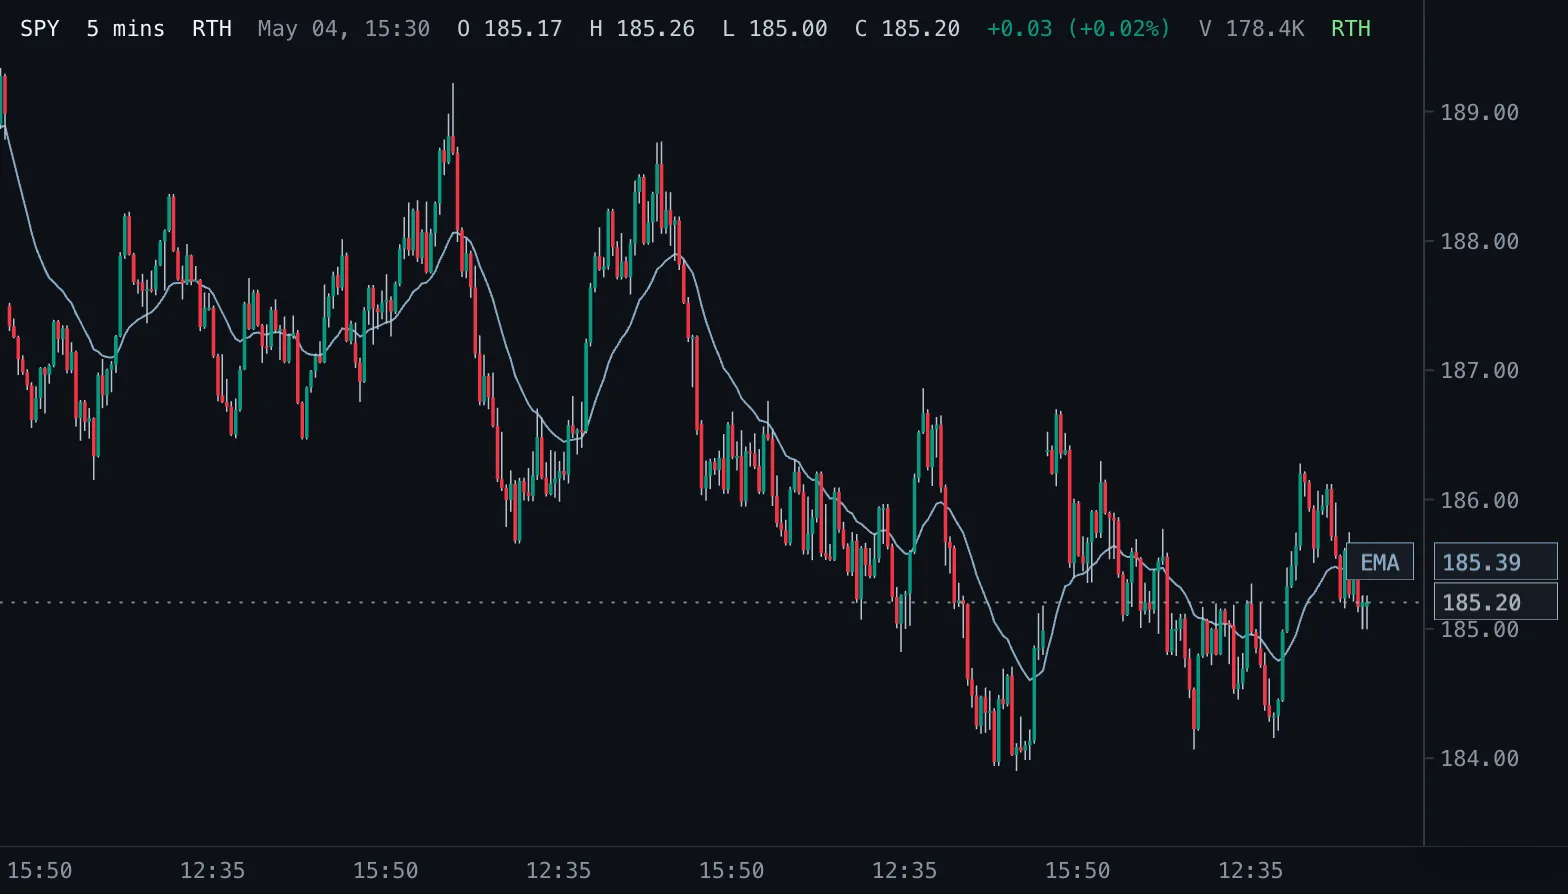
Exponential Moving Average EMA
Exponential moving average of the chosen price, weighting recent bars more, drawn on the candles.
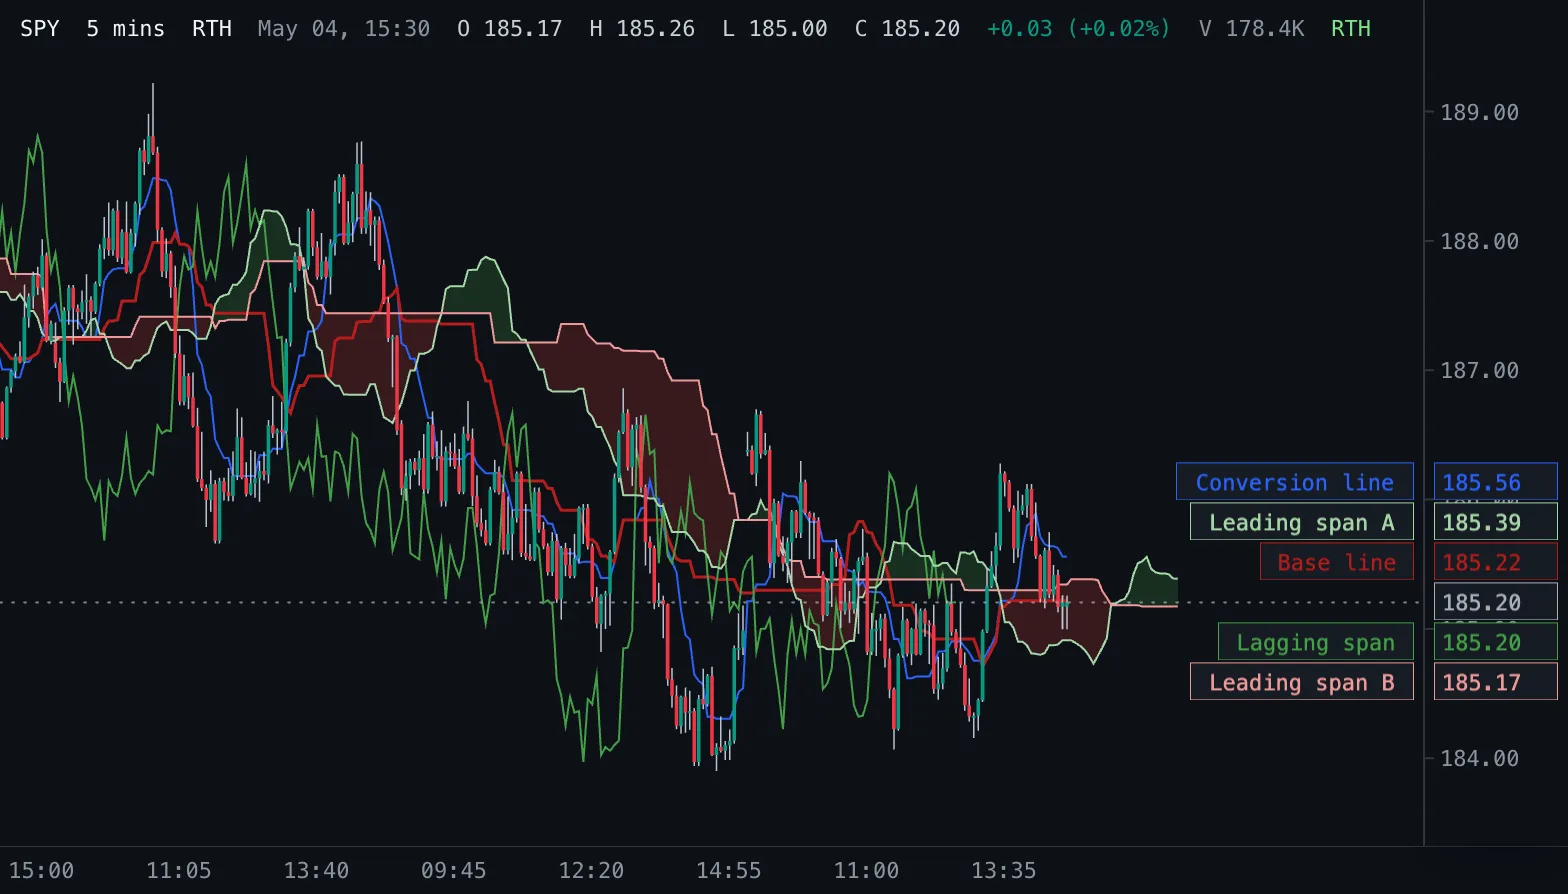
Ichimoku Cloud Ichimoku
Ichimoku Kinko Hyo: conversion and base lines, a cloud of two leading spans projected into the future, and the lagging close.
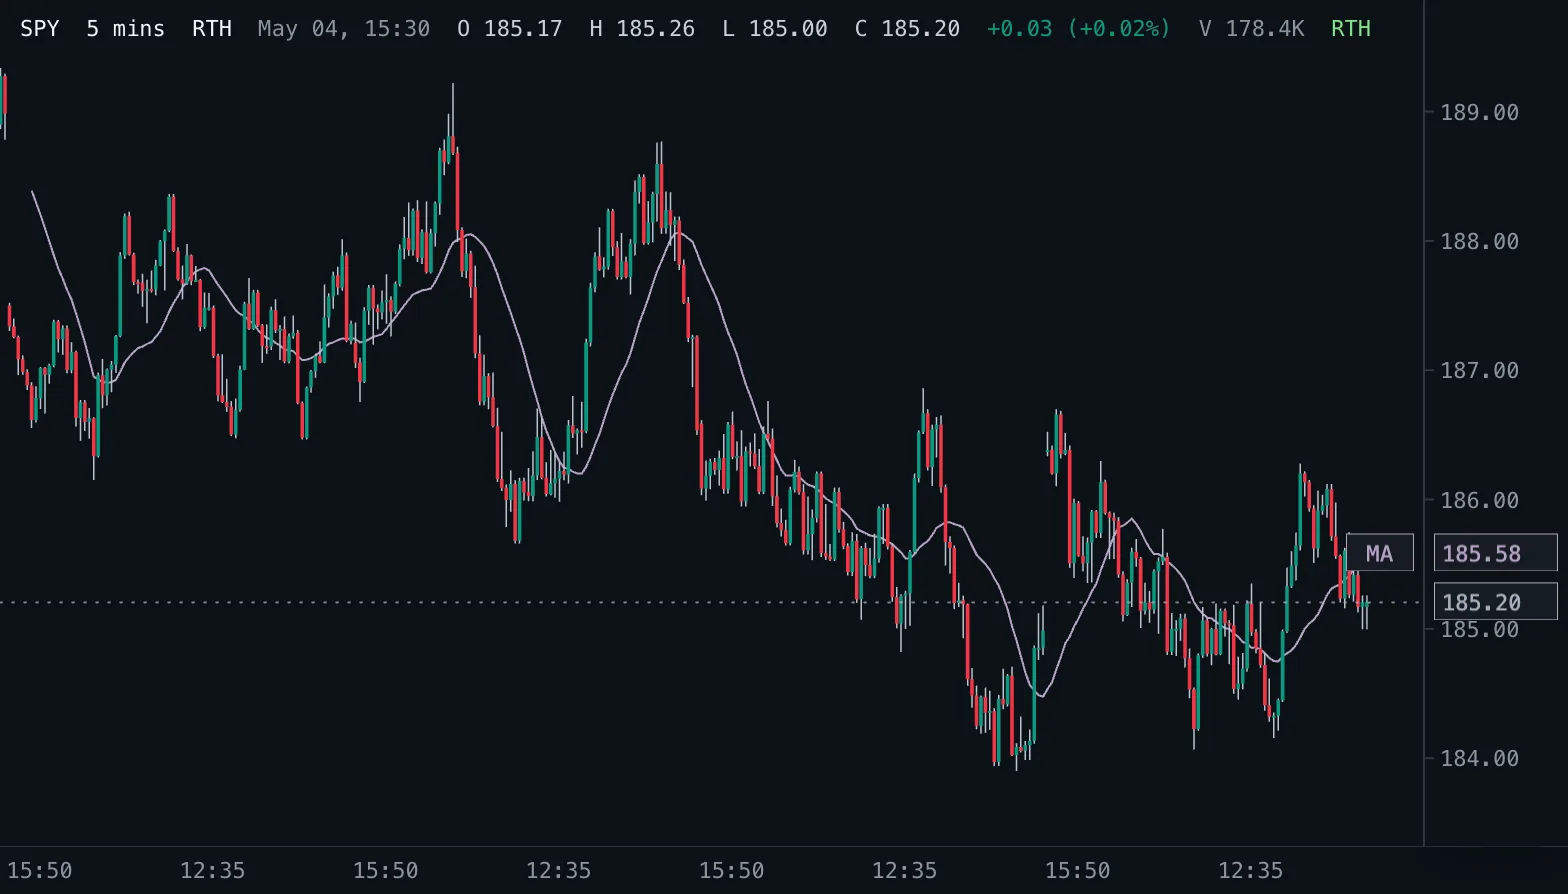
Moving Average MA
One moving average of the type you choose (simple, exponential, weighted, Hull, Wilder or volume-weighted) and any length, drawn on the candles.
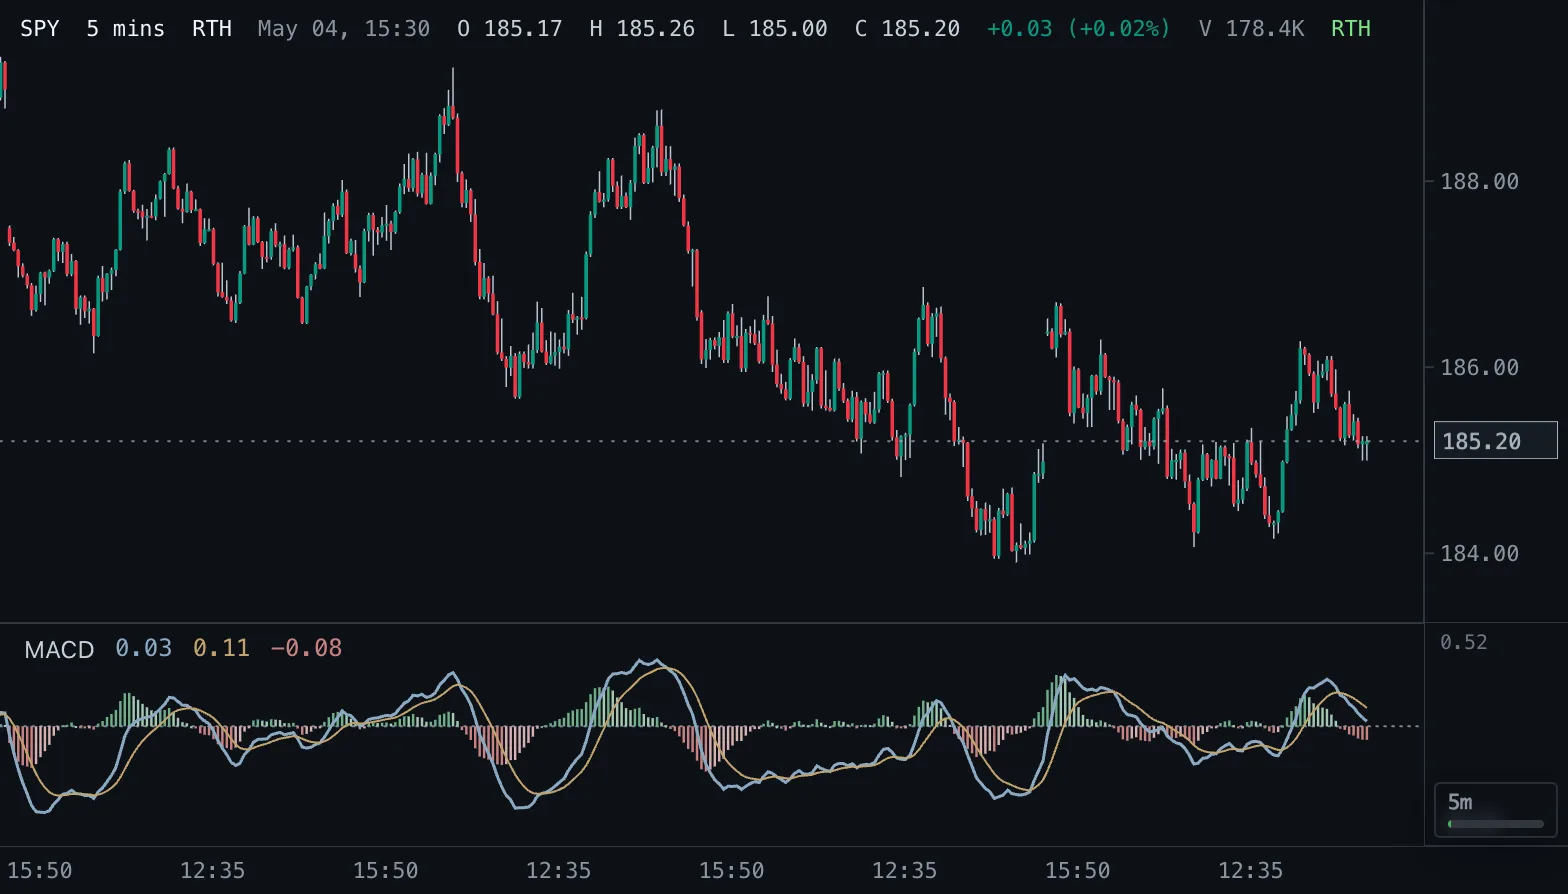
Moving Average Convergence Divergence MACD
MACD line, signal line and a four-color histogram that shows whether momentum is rising or falling.
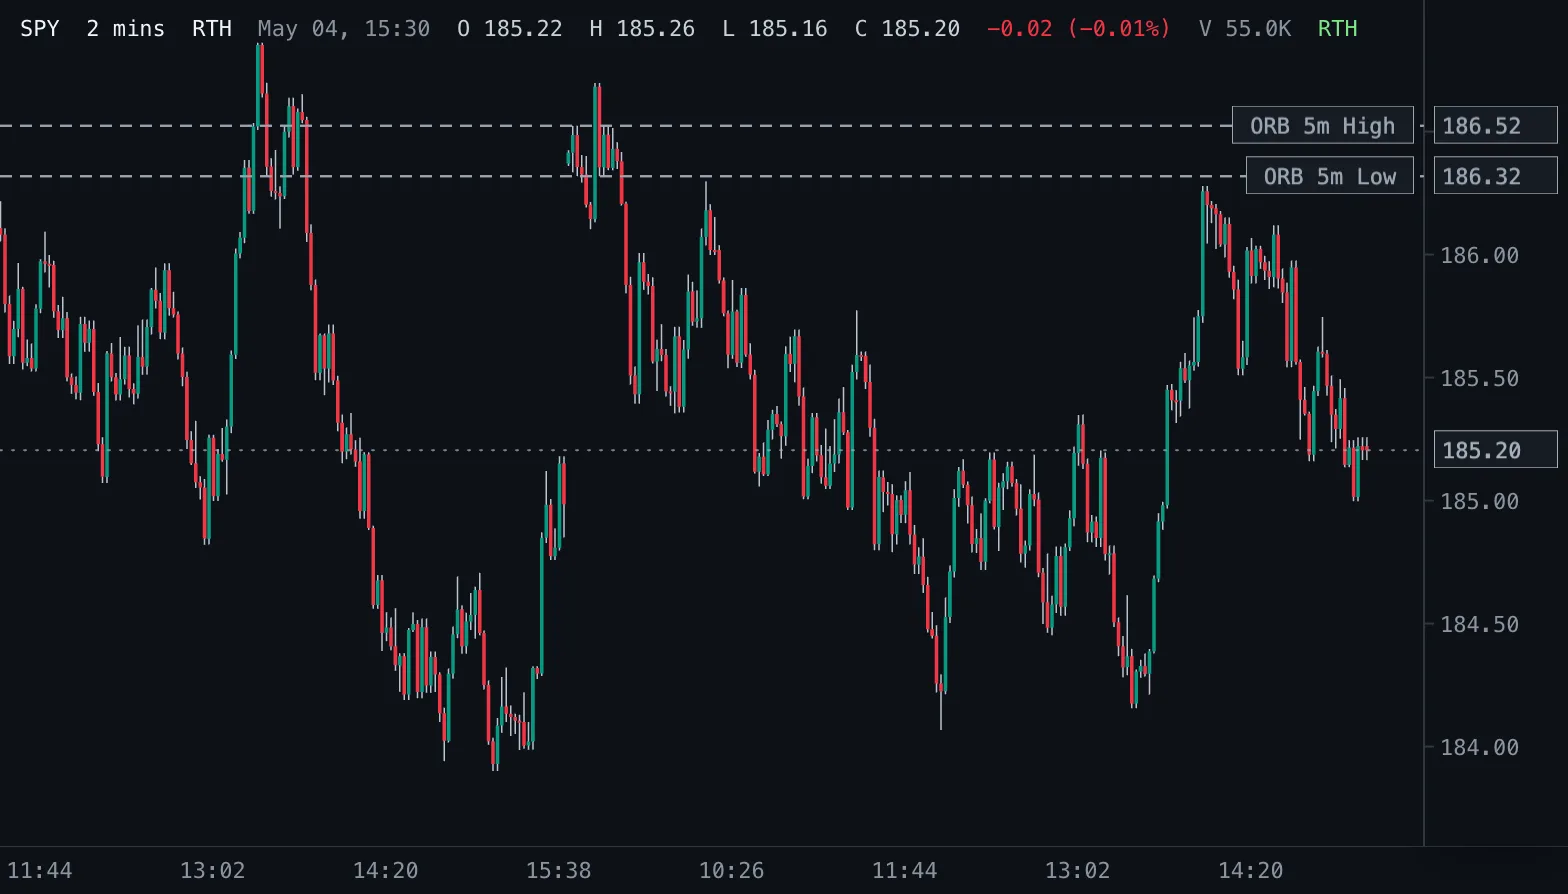
Opening Range Breakout ORB
Opening-range highs and lows for 1, 2, 5, 10, 15, 30 and 60 minutes after the 09:30 New York open.
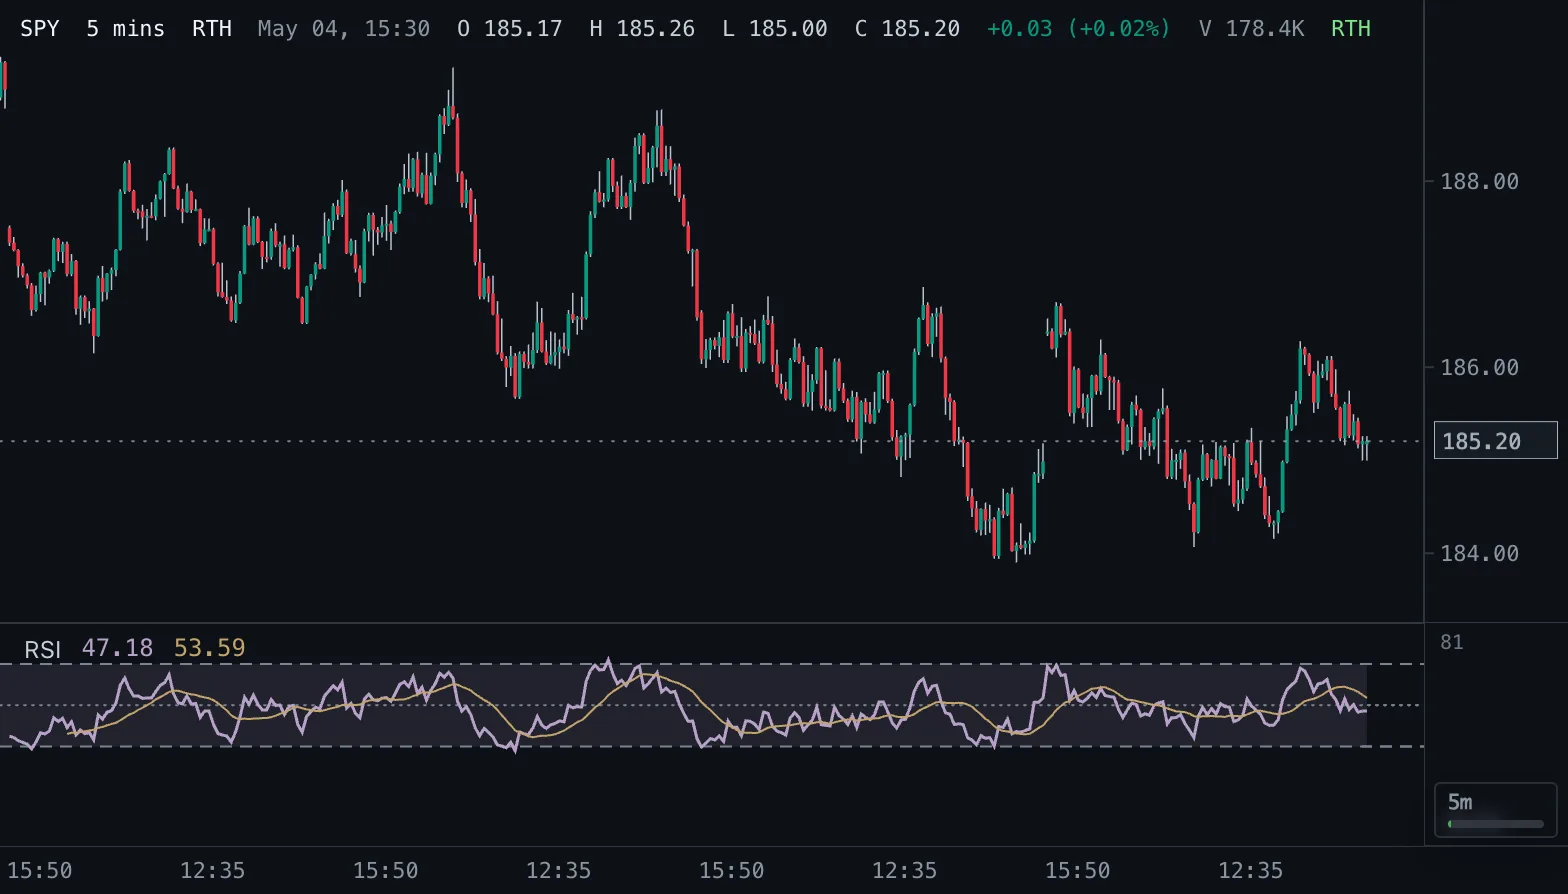
Relative Strength Index RSI
Wilder RSI on a 0-100 scale with a smoothing average and 30/50/70 reference bands.
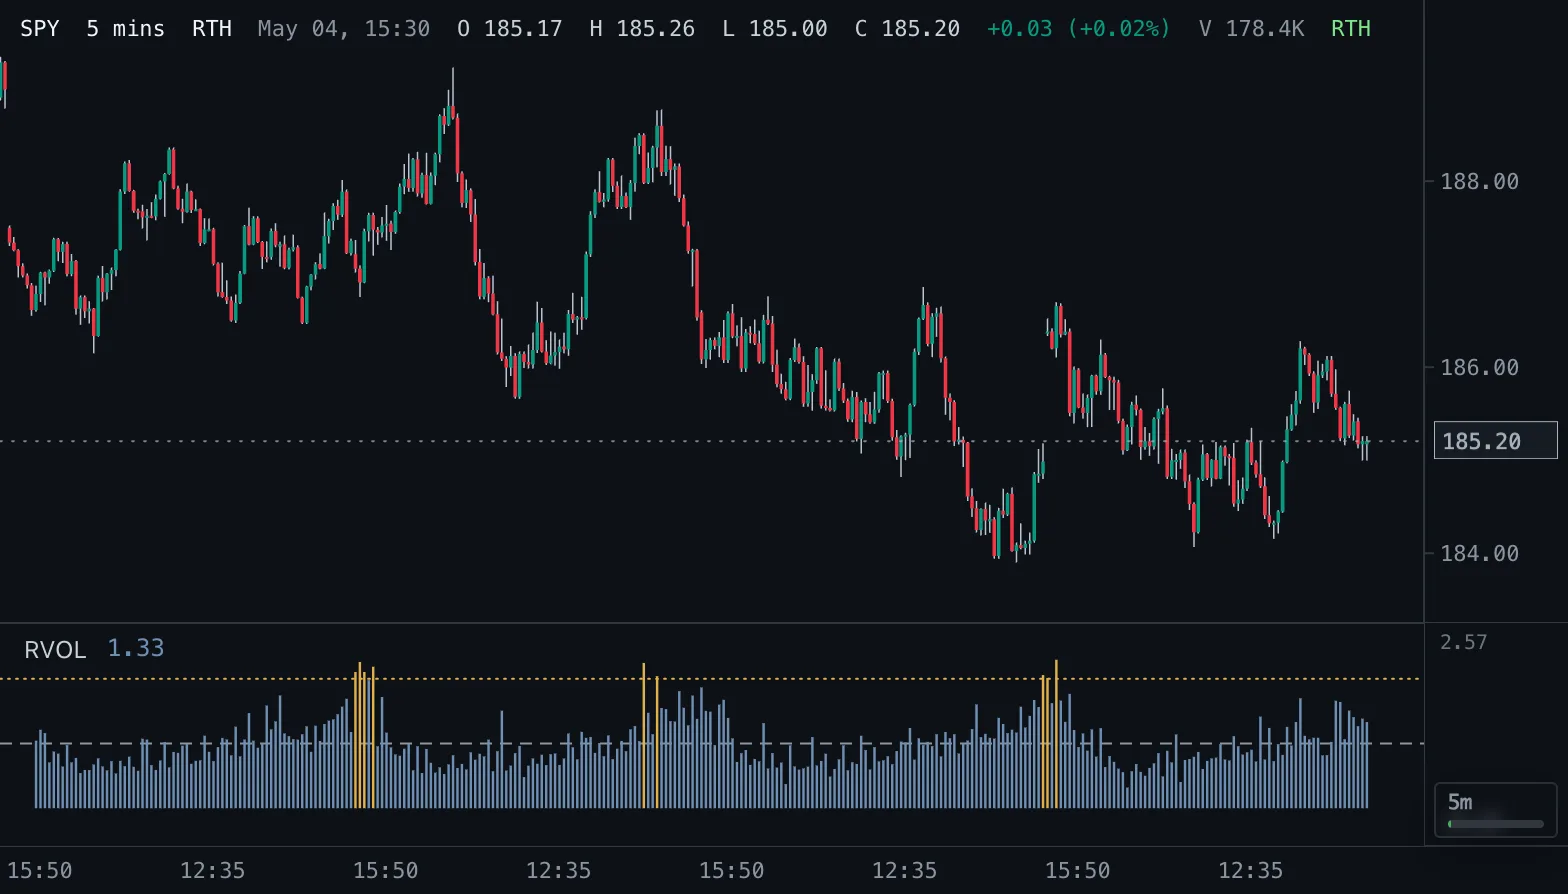
Relative Volume RVOL
Volume as a multiple of normal: against the average of the prior bars, or against the same time of day on earlier sessions.
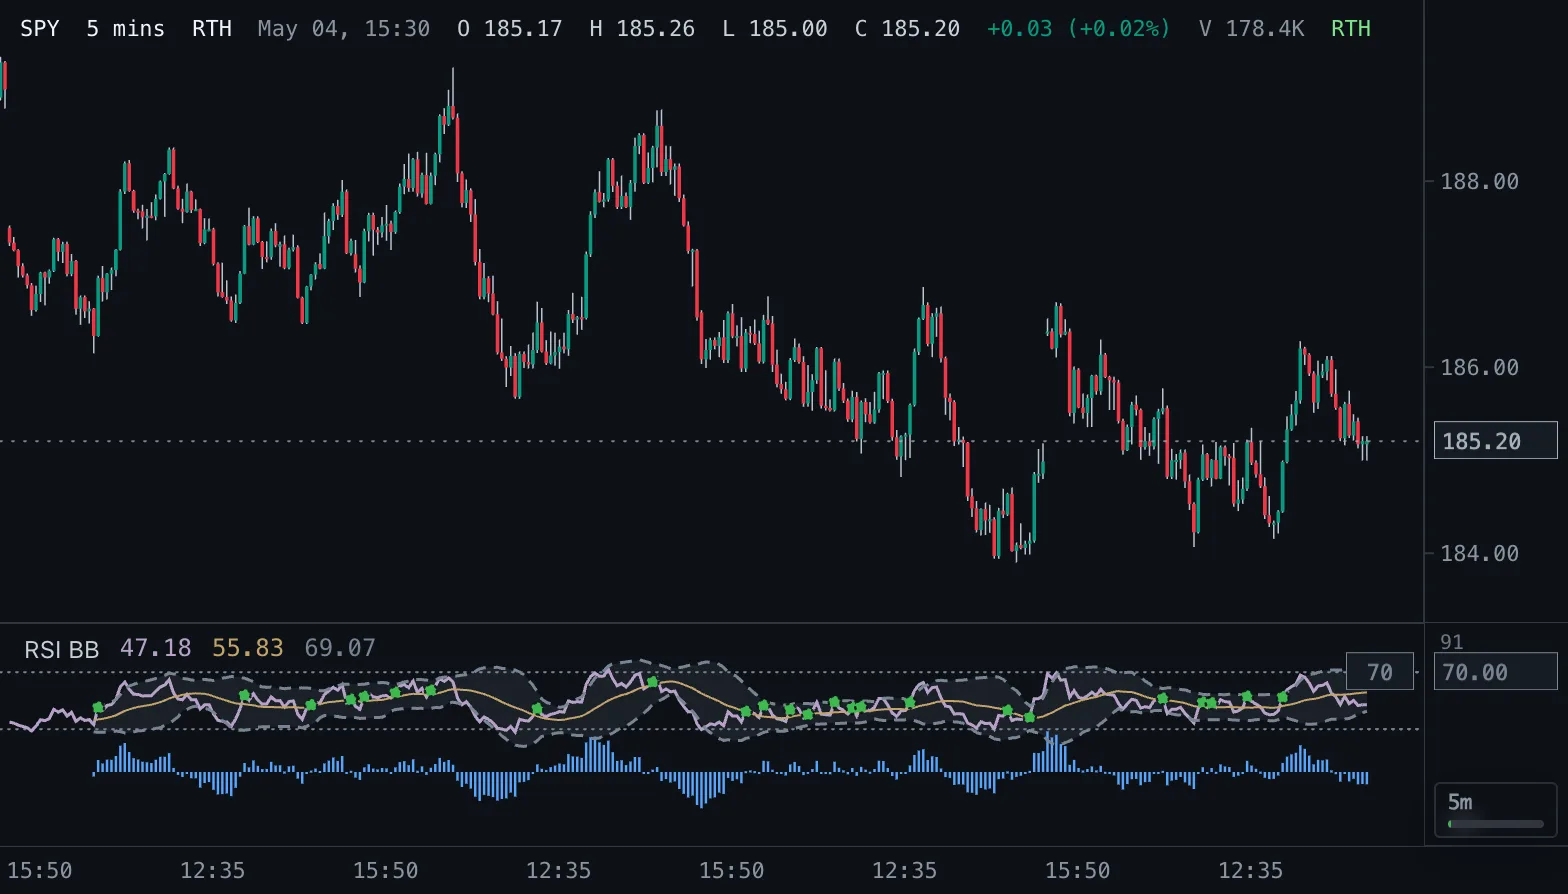
RSI with Bollinger Bands RSI BB
RSI with a Bollinger envelope around its moving average, 30/70 guides and crossover dots.
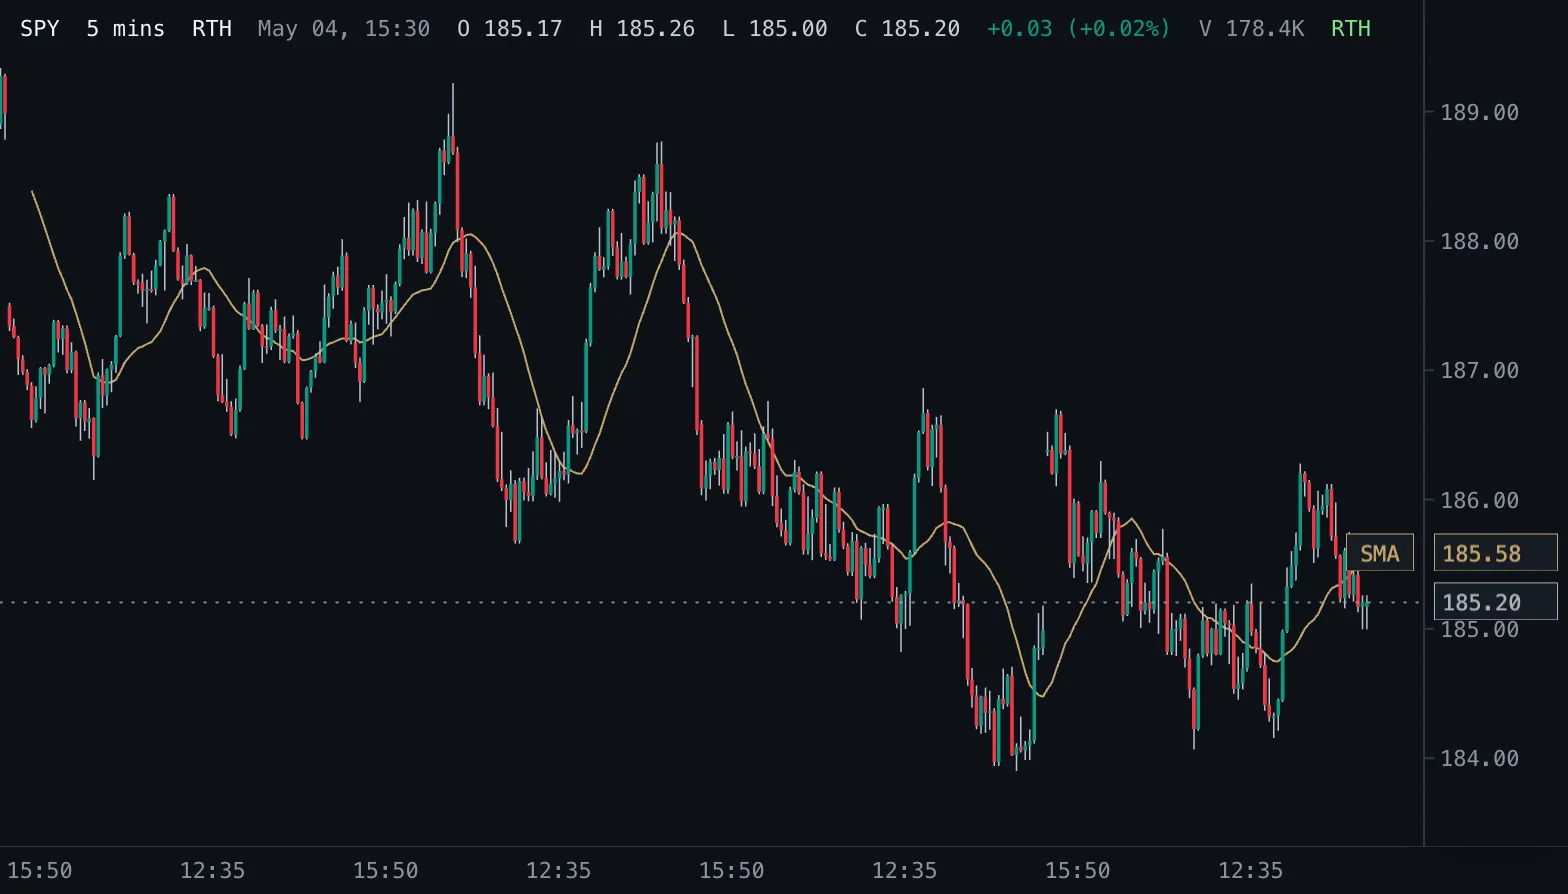
Simple Moving Average SMA
Simple moving average of the chosen price over a fixed number of bars, drawn on the candles.
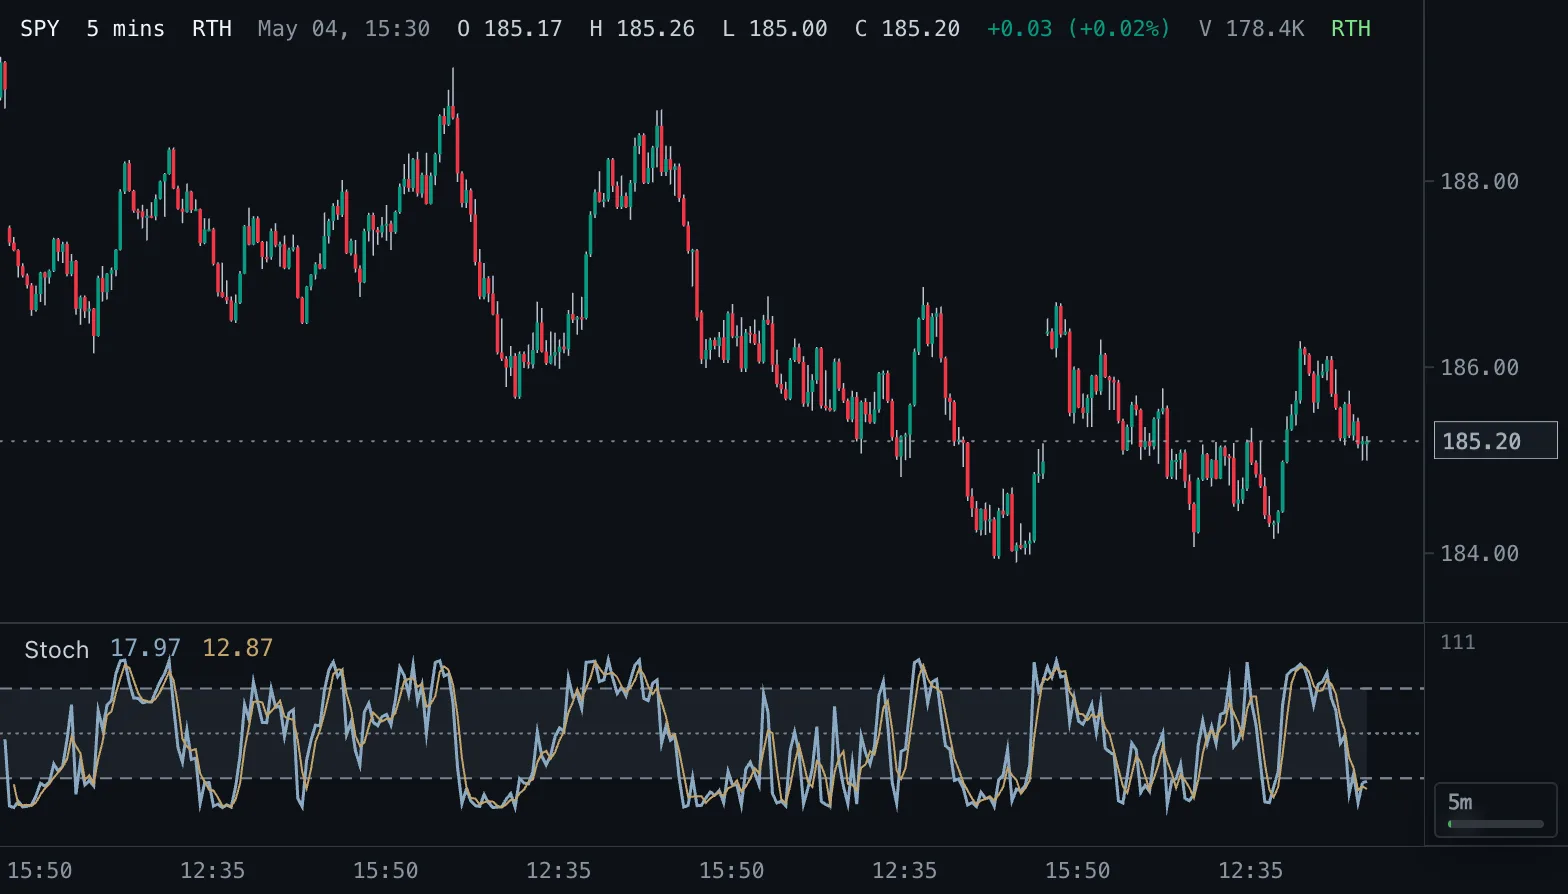
Stochastic Oscillator Stoch
Where the close sits inside the recent high-low range, on a 0-100 scale, with %K, a %D signal line and 80/20 bands.
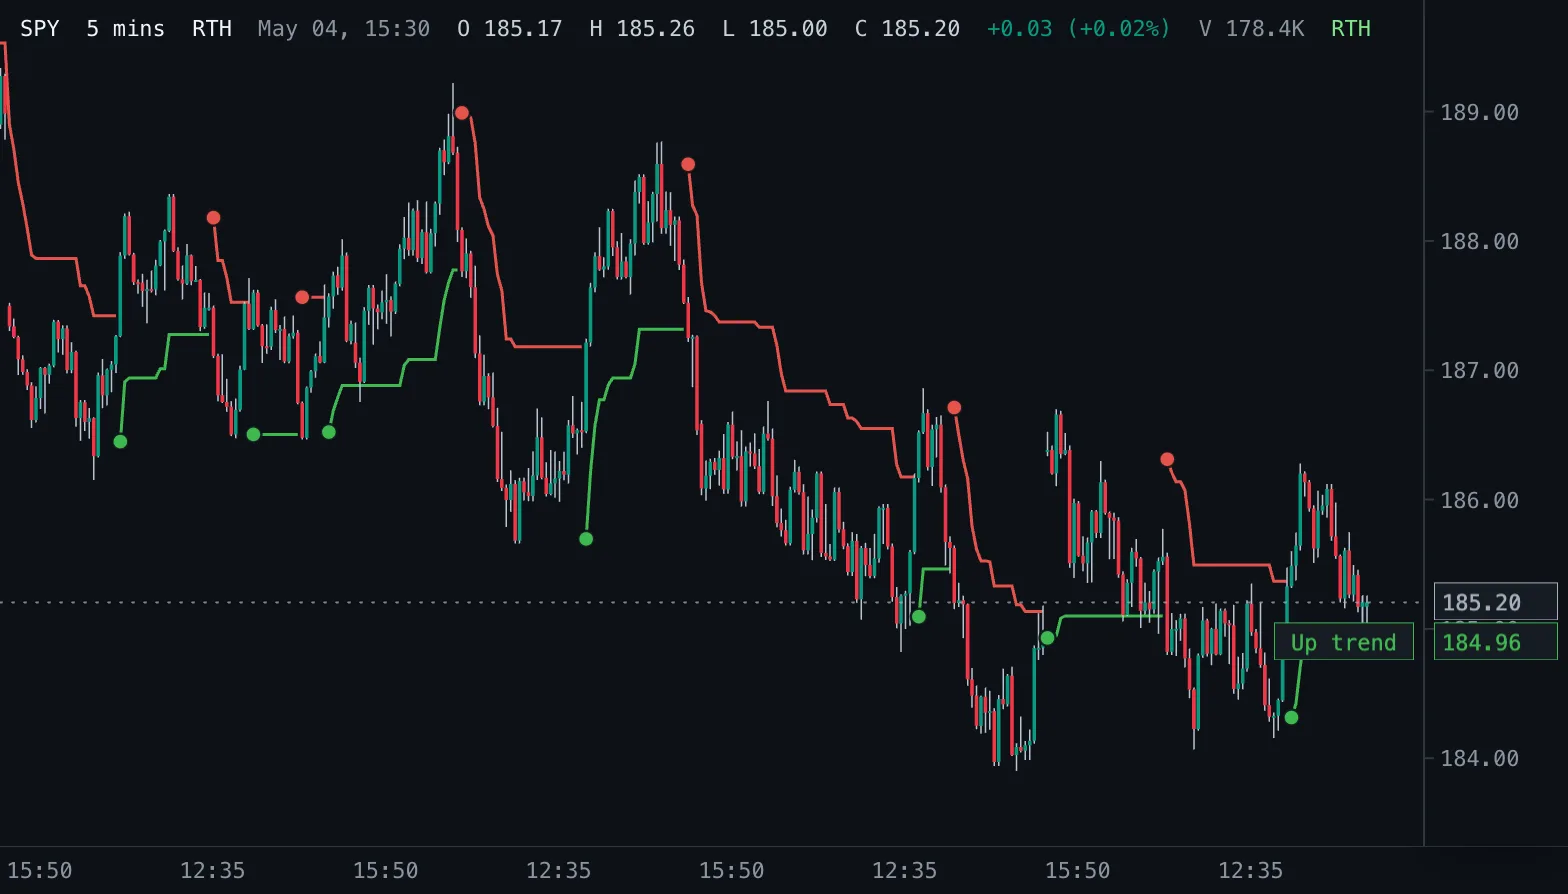
Supertrend ST
A trailing stop line that follows price at a multiple of the ATR: green below price in an uptrend, red above it in a downtrend.
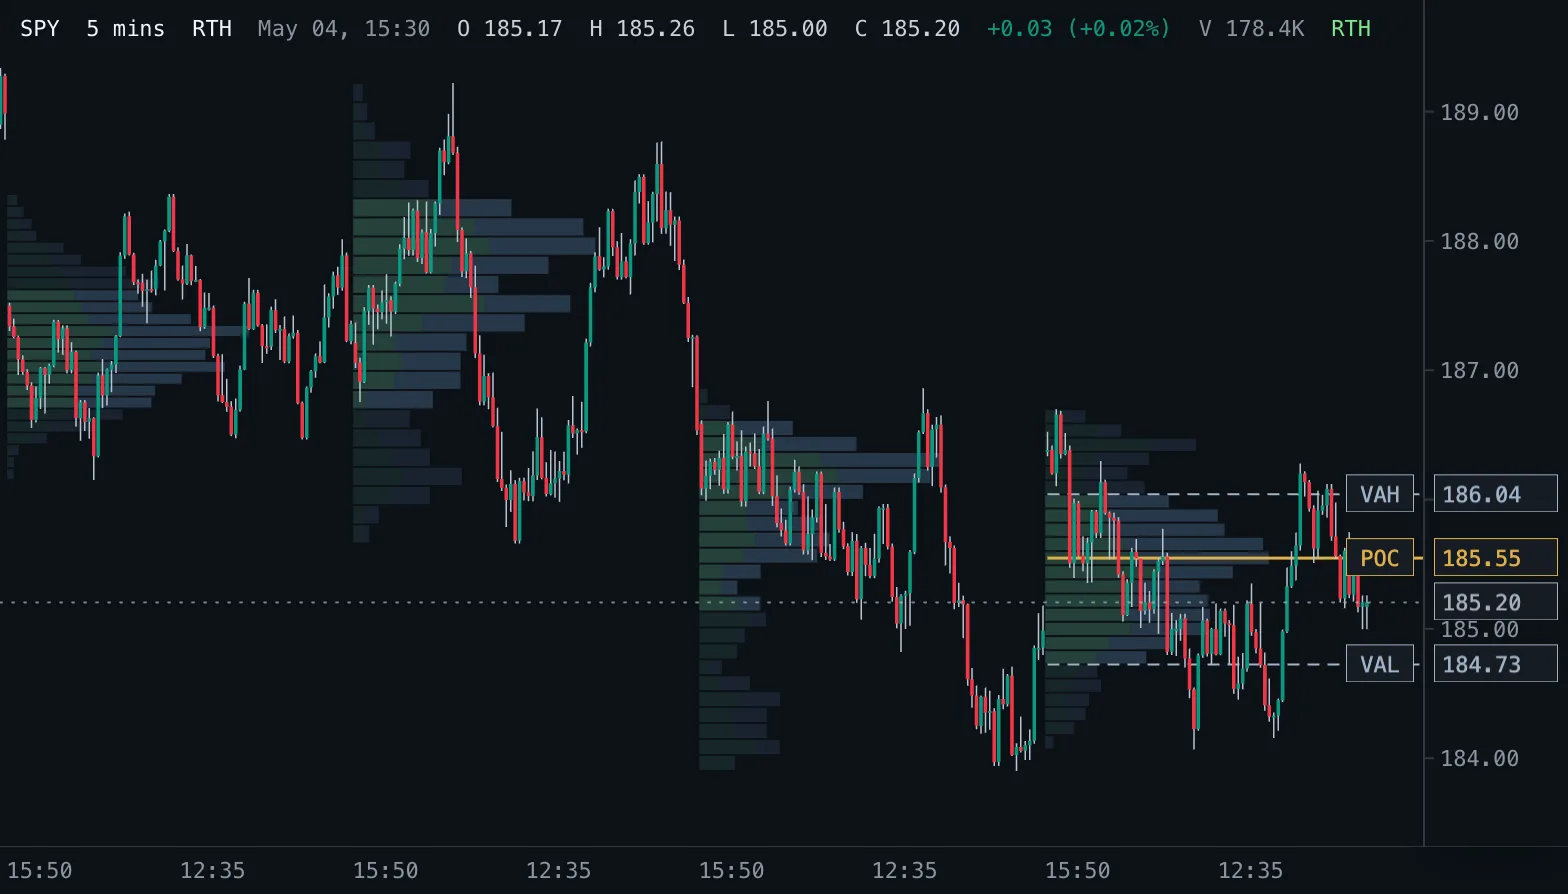
Volume Profile VP
Volume traded at each price as horizontal rows, per session, over a fixed range or for the bars on screen, with point of control and value area.
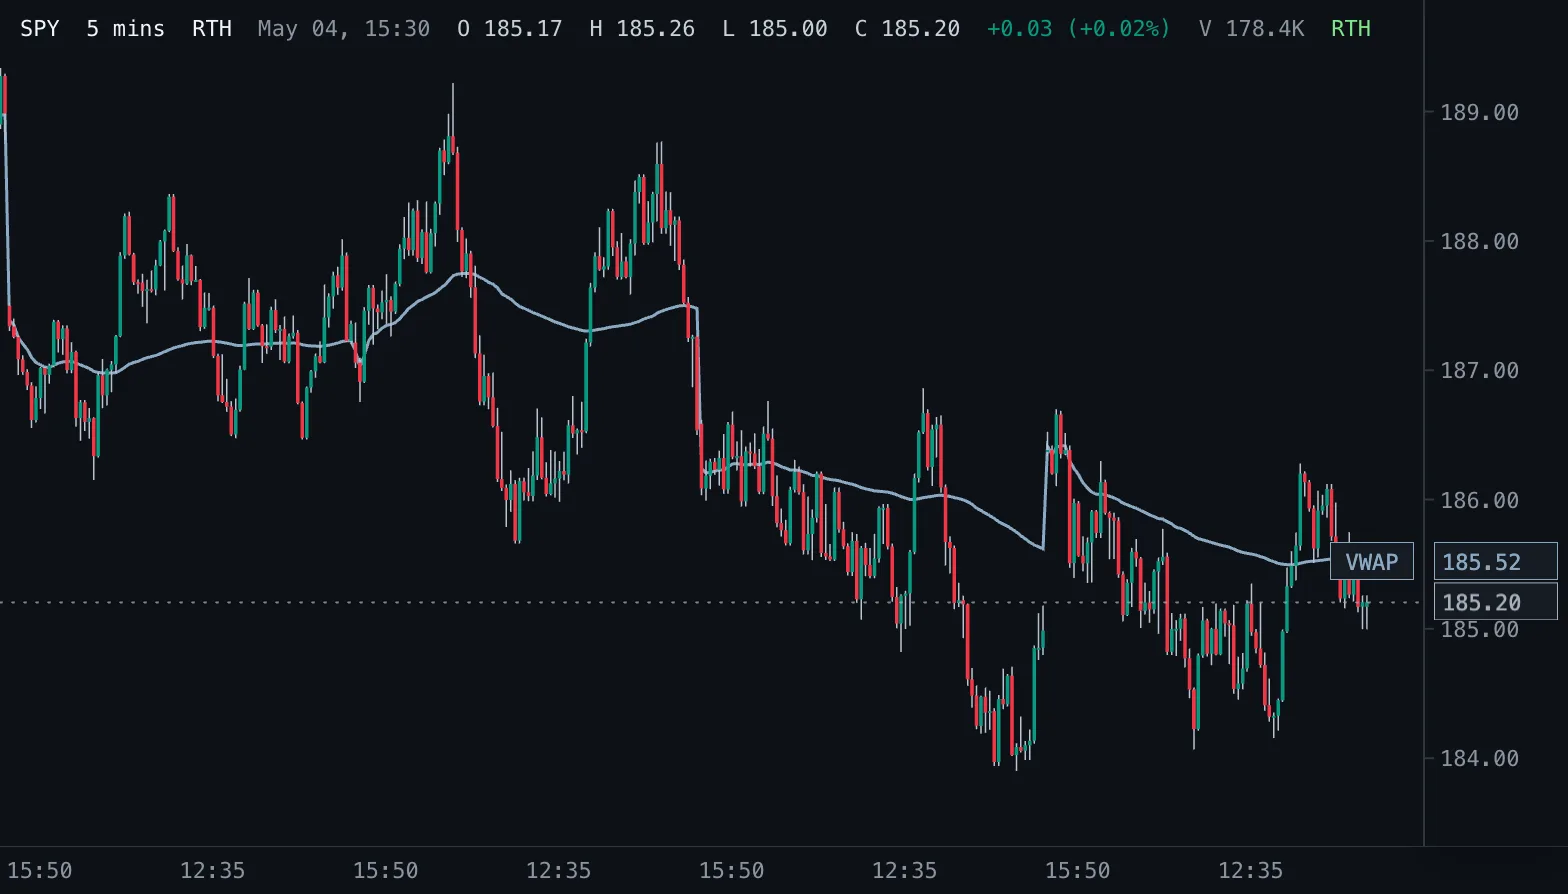
VWAP VWAP
Session volume-weighted average price that starts fresh on every New York trading date.
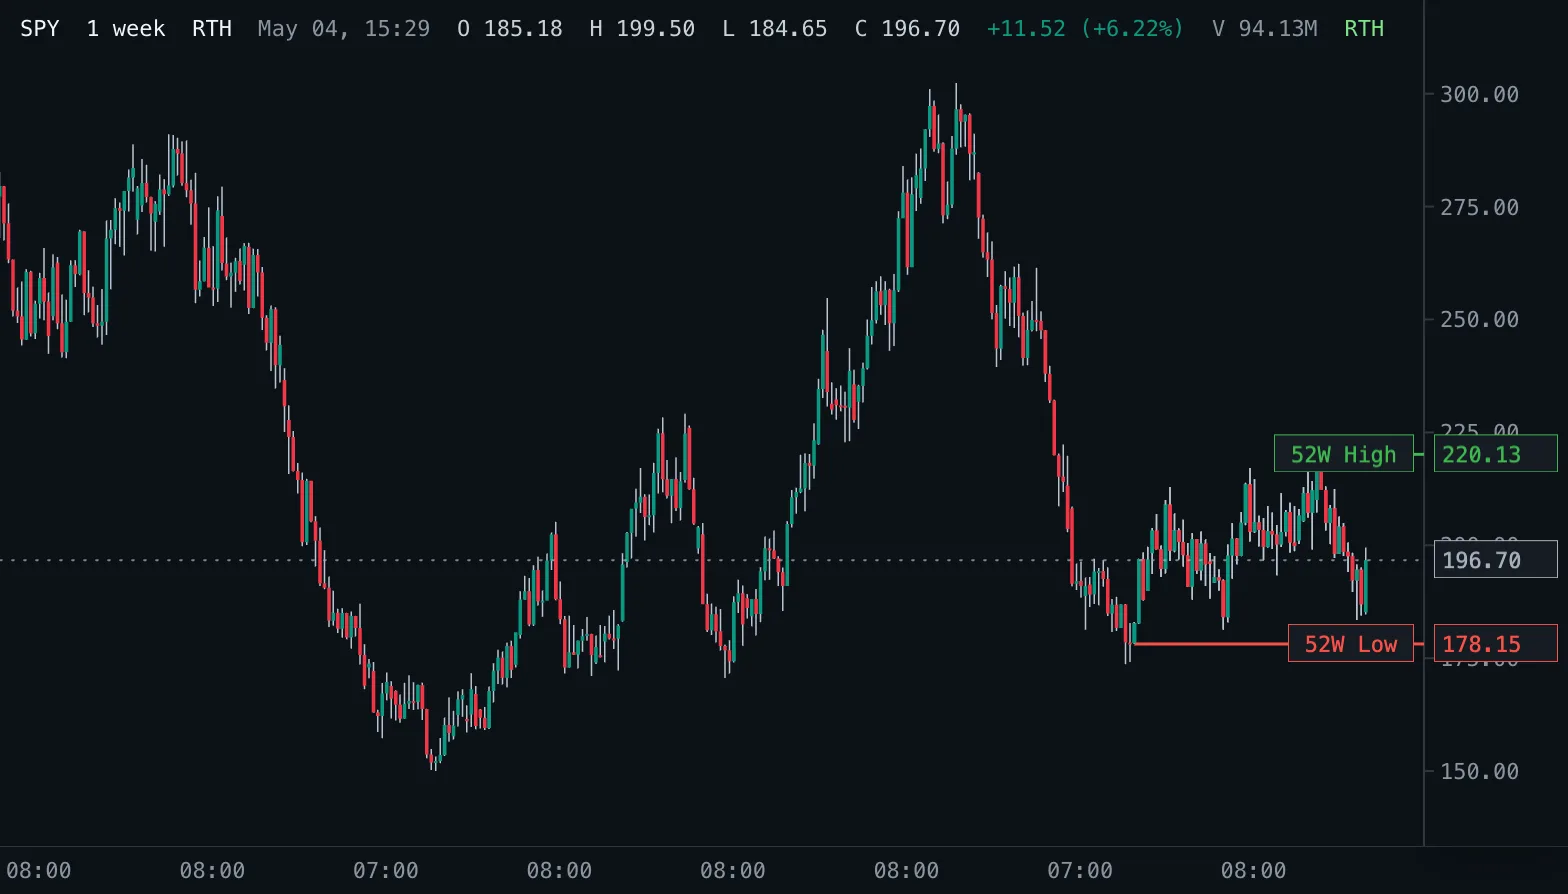
52-Week High/Low 52W H/L
The highest high and lowest low of the last 52 weeks as levels, read from real daily bars.
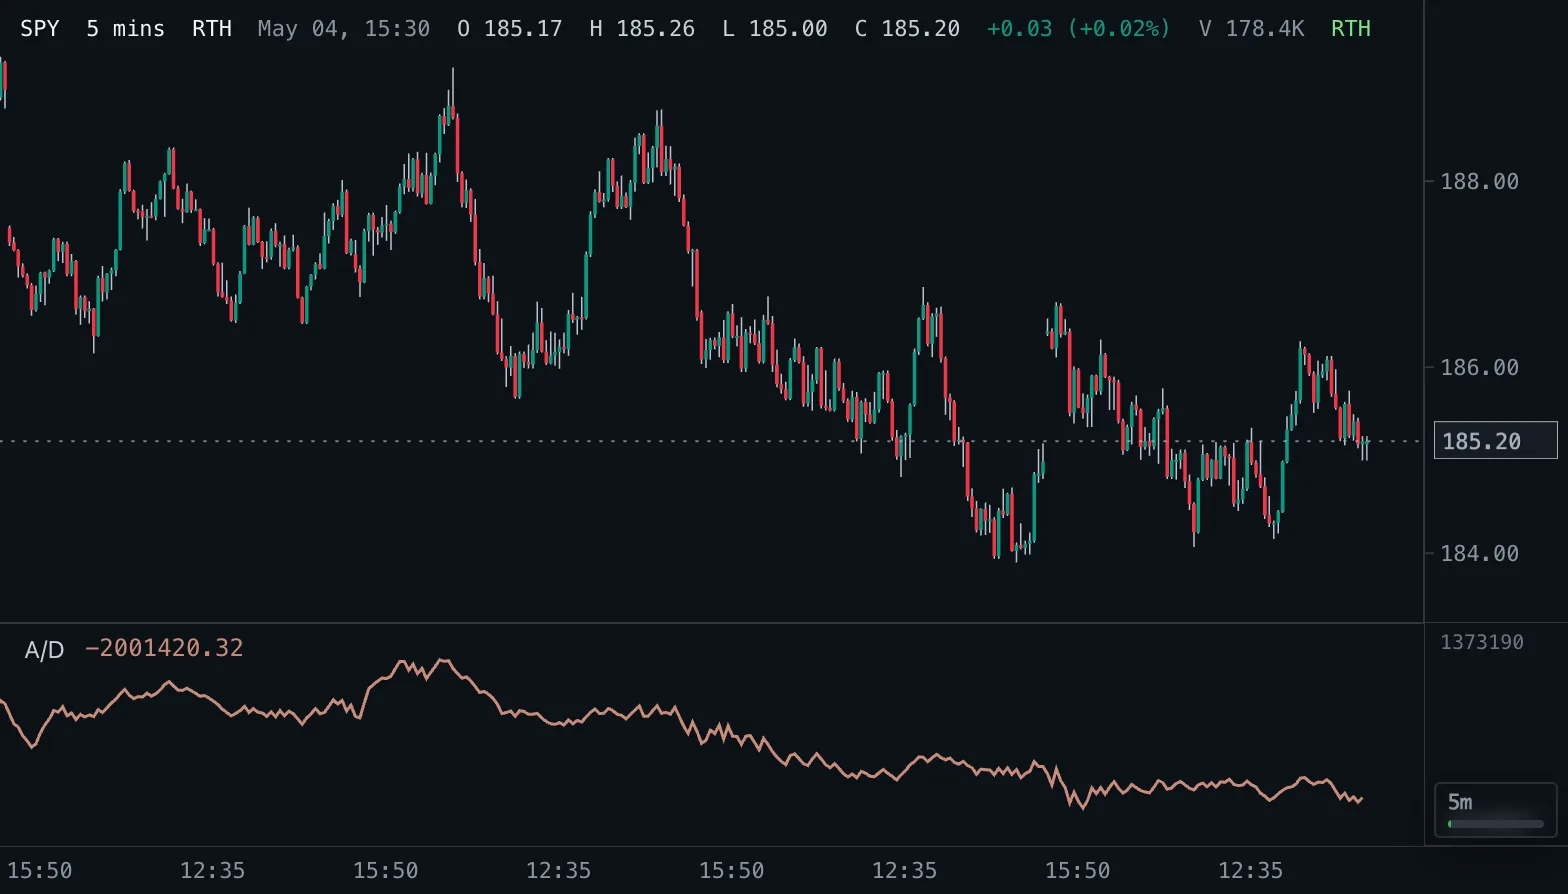
Accumulation/Distribution A/D
Running total of volume weighted by where each bar closes inside its range: rising on accumulation, falling on distribution.
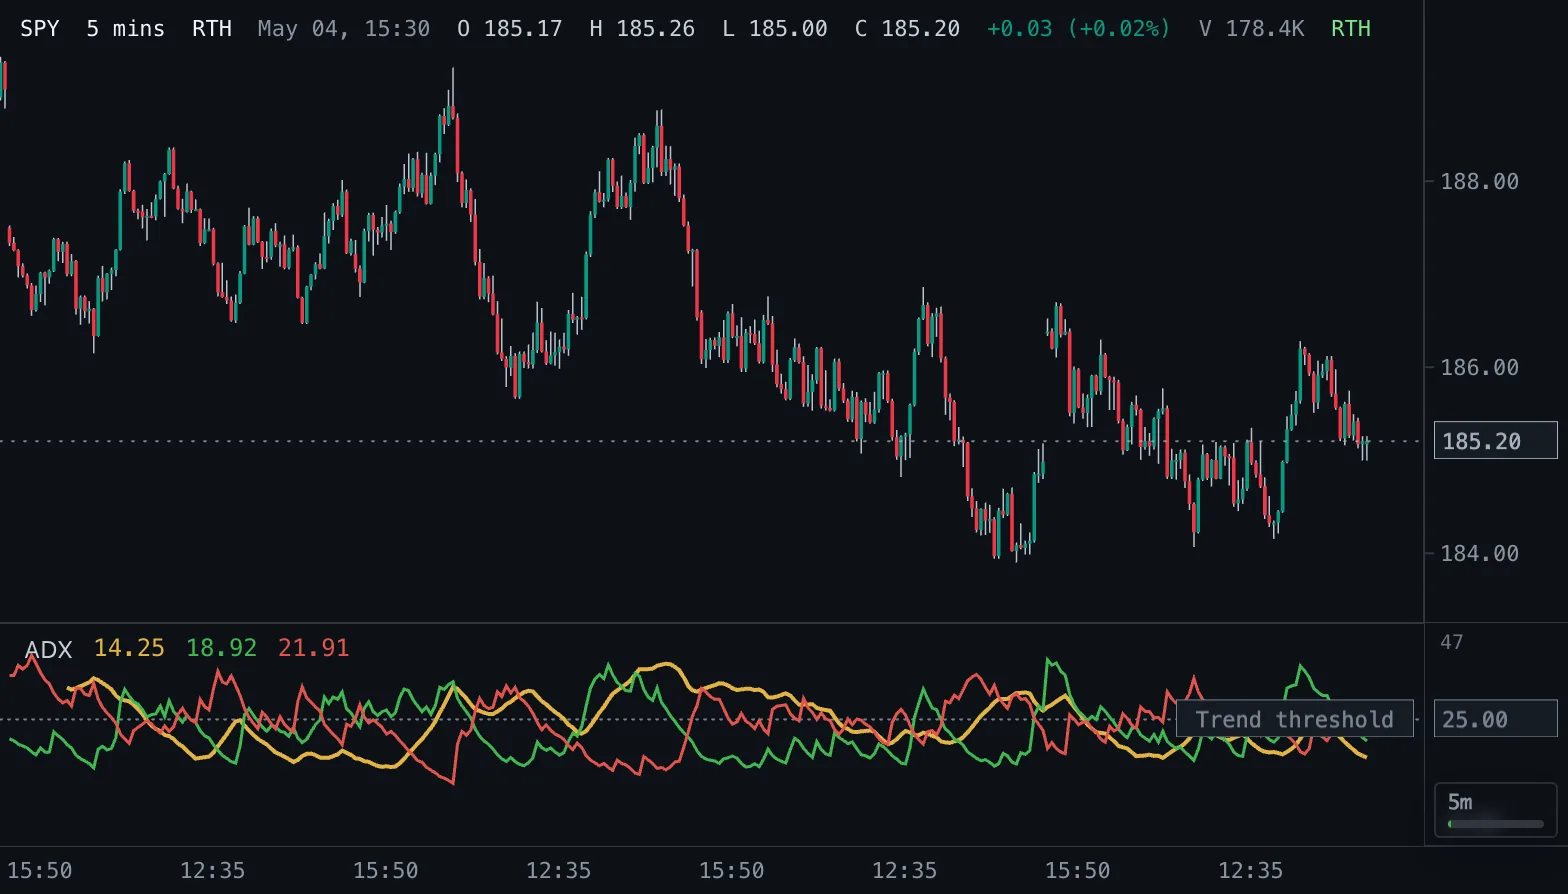
ADX & DMI ADX
Wilder's Directional Movement Index: ADX for trend strength and +DI and -DI for its direction.
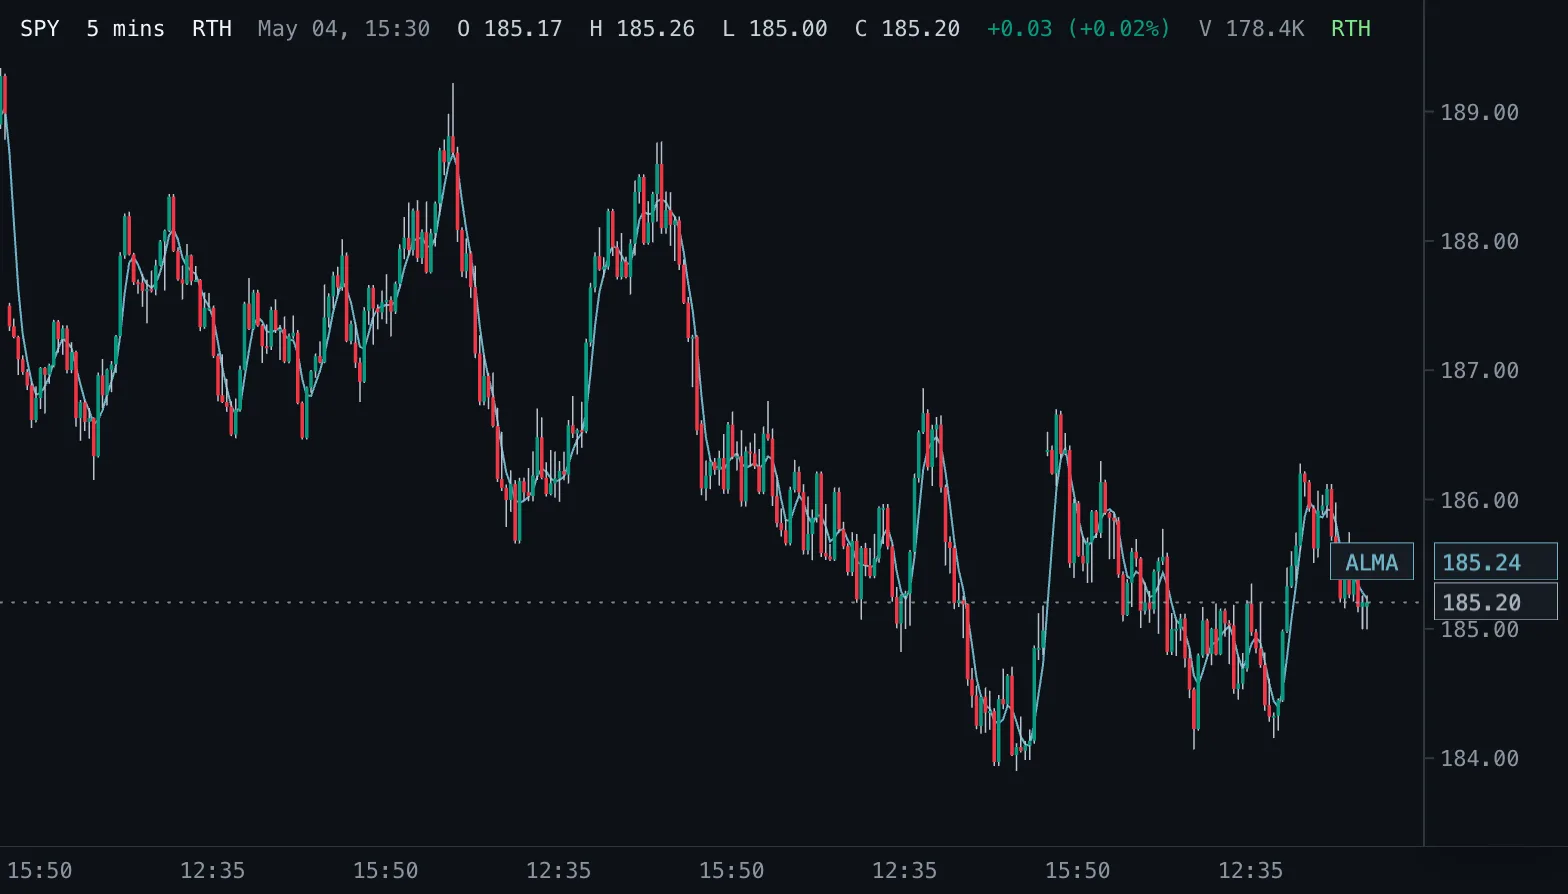
Arnaud Legoux Moving Average ALMA
Arnaud Legoux and Dimitris Kouzis-Loukas' moving average: a Gaussian-weighted window tilted toward recent bars, drawn on the candles.
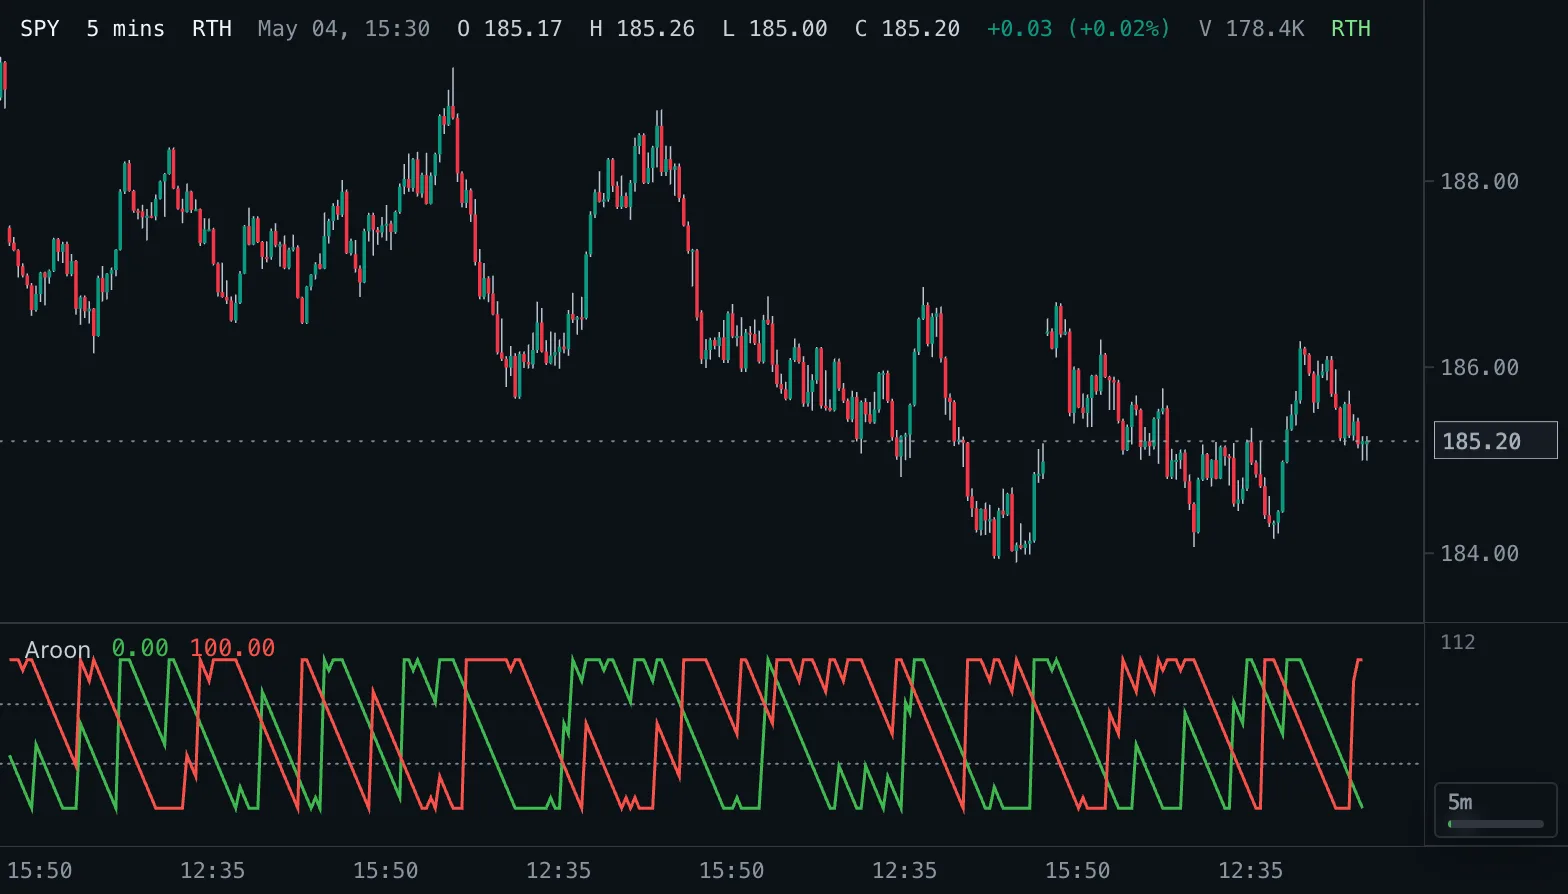
Aroon Aroon
Aroon Up and Aroon Down: how recently price made its highest high and its lowest low, from 0 to 100.
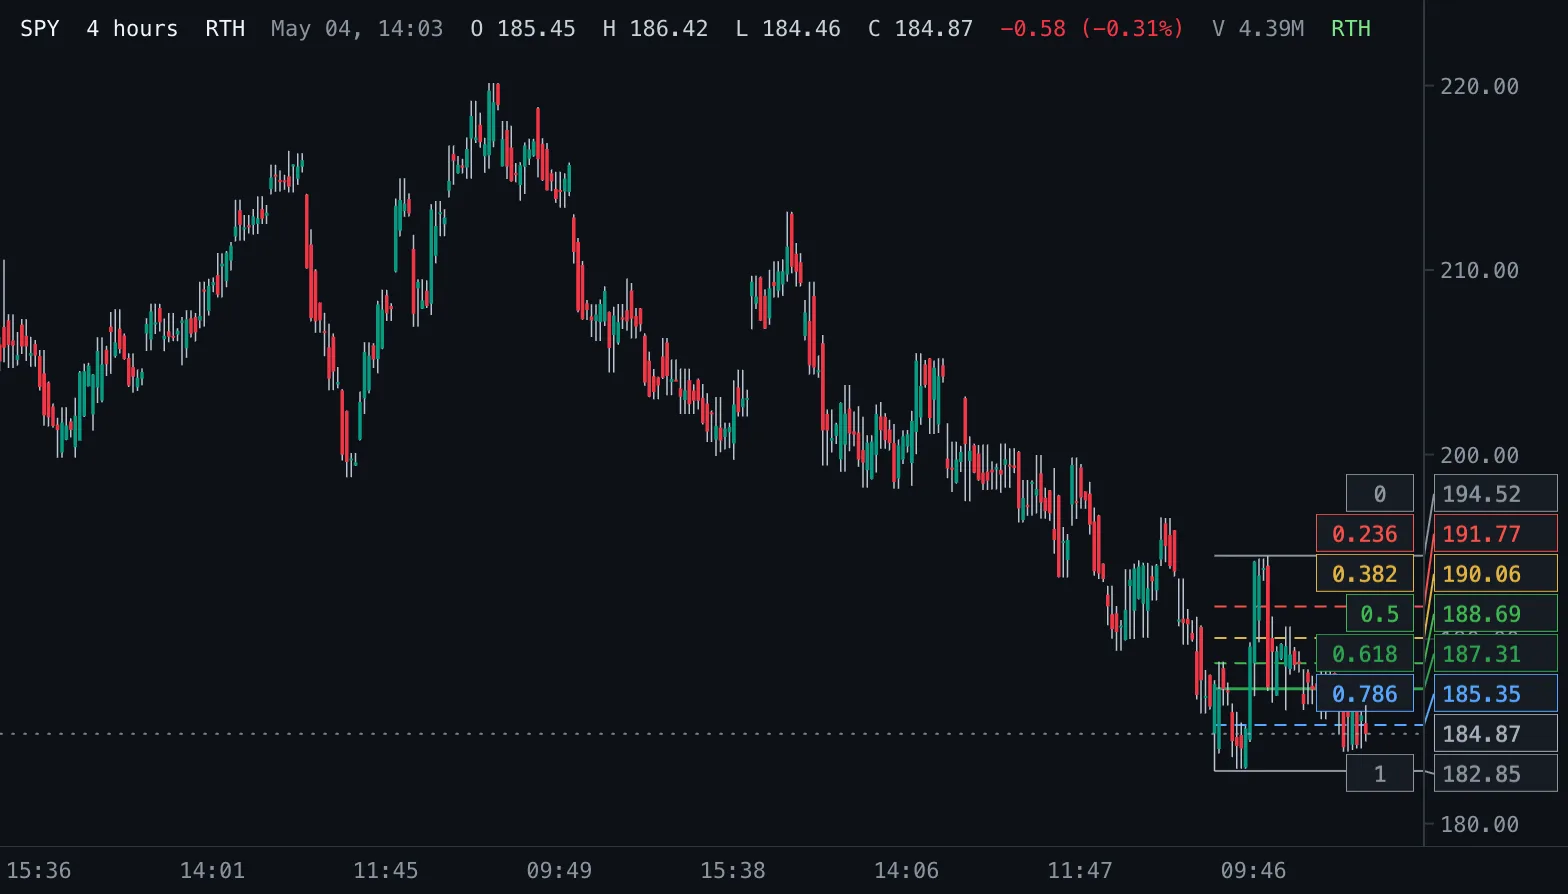
Auto Fib Retracement Auto Fib
Fibonacci retracement levels of the latest confirmed swing, with a swing size that scales with volatility, and optional extensions beyond the swing.
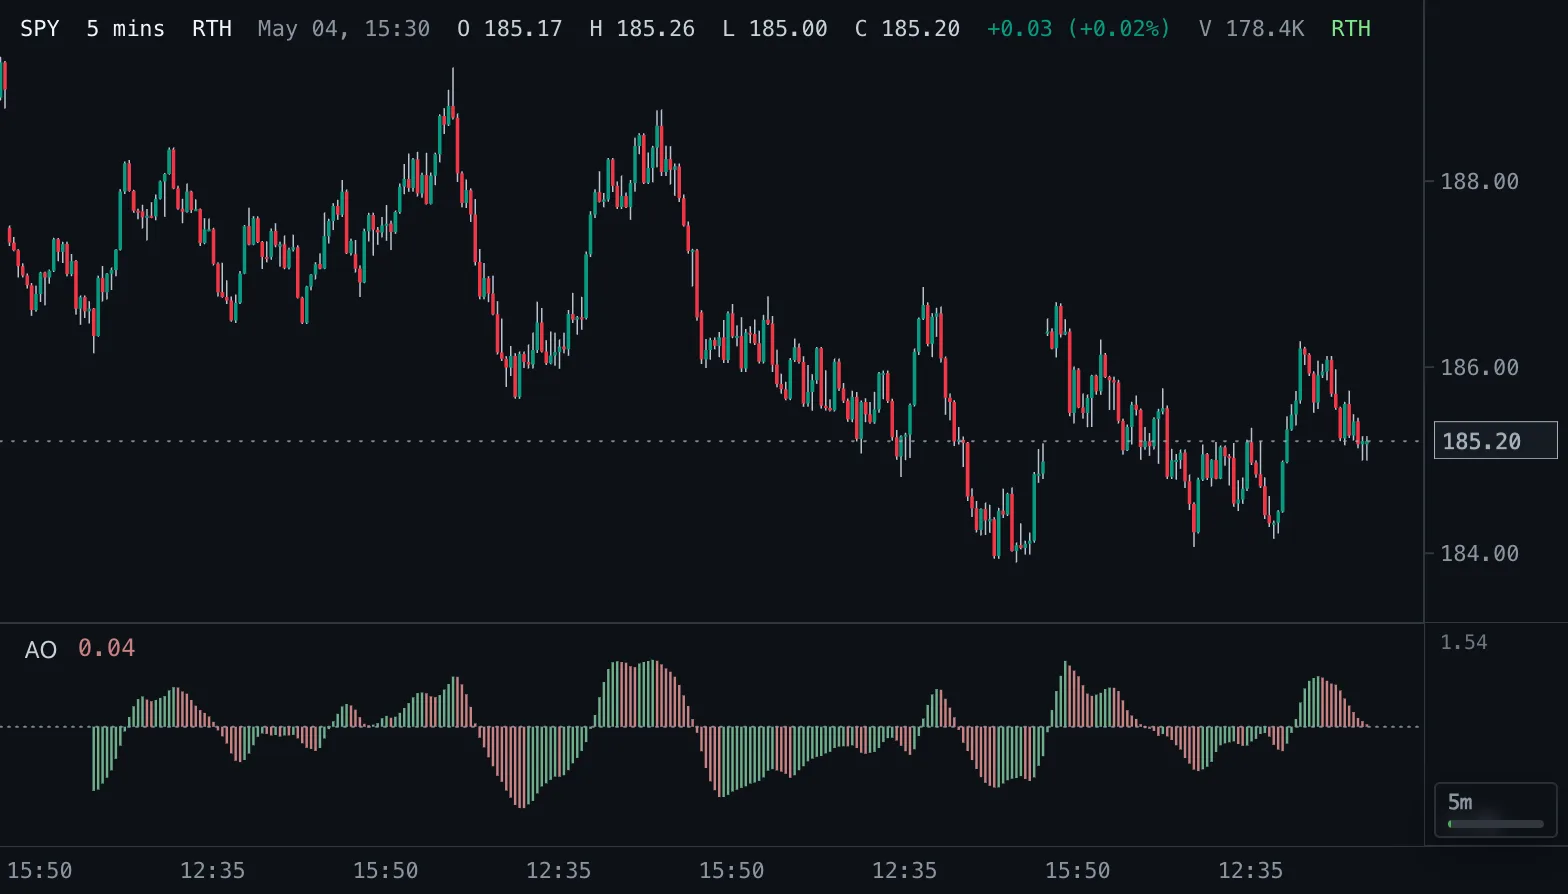
Awesome Oscillator AO
Fast minus slow simple average of the median price, as columns colored by whether they rise or fall.
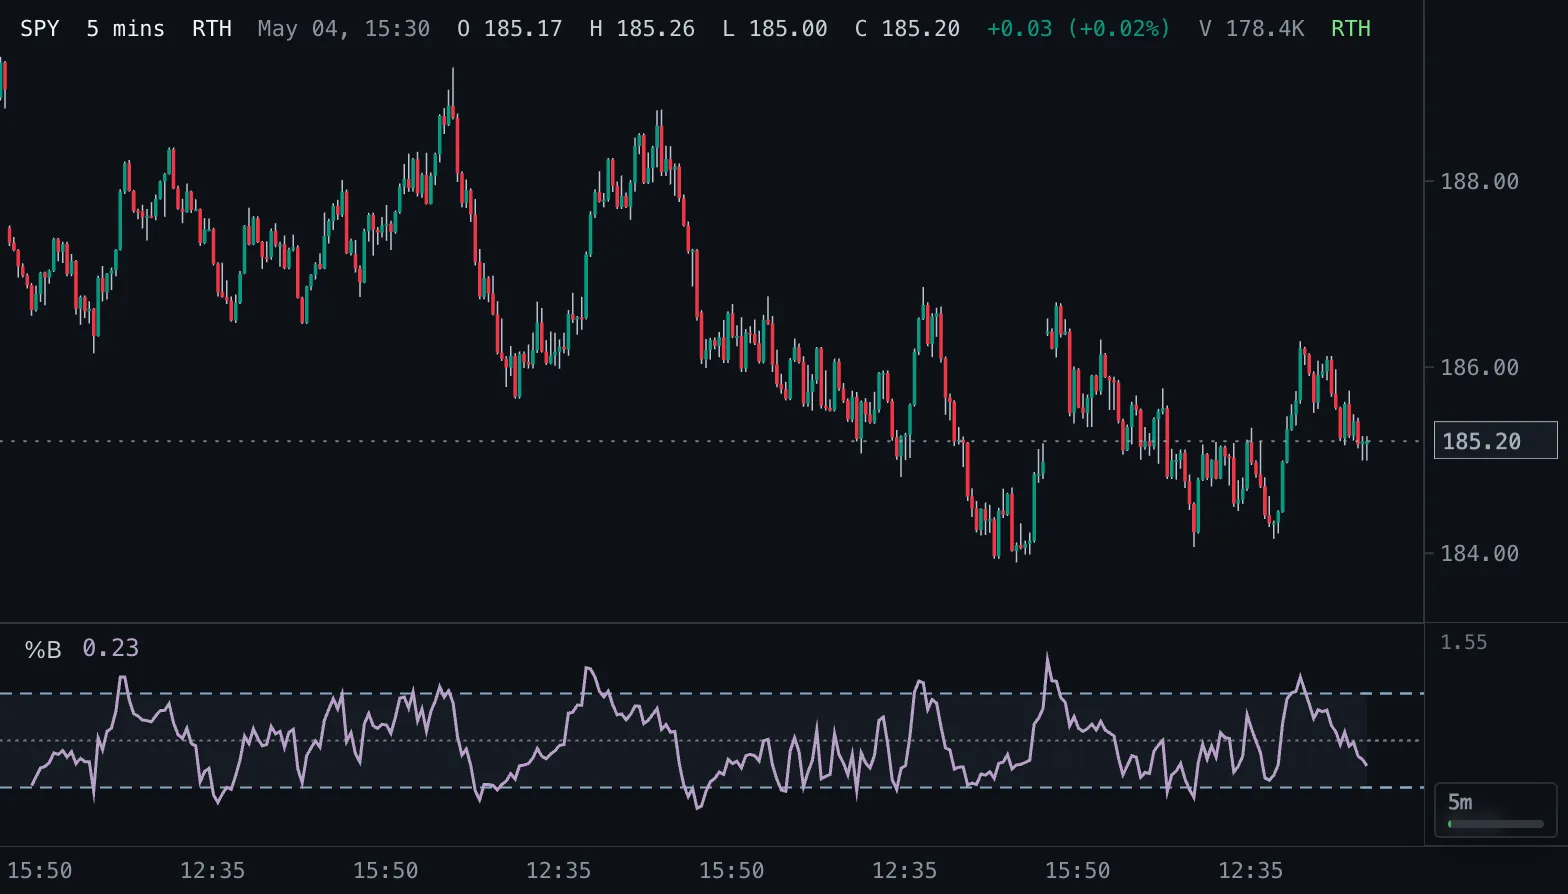
Bollinger %B %B
Where price sits within its Bollinger Bands: 1 at the upper band, 0.5 at the basis, 0 at the lower band.
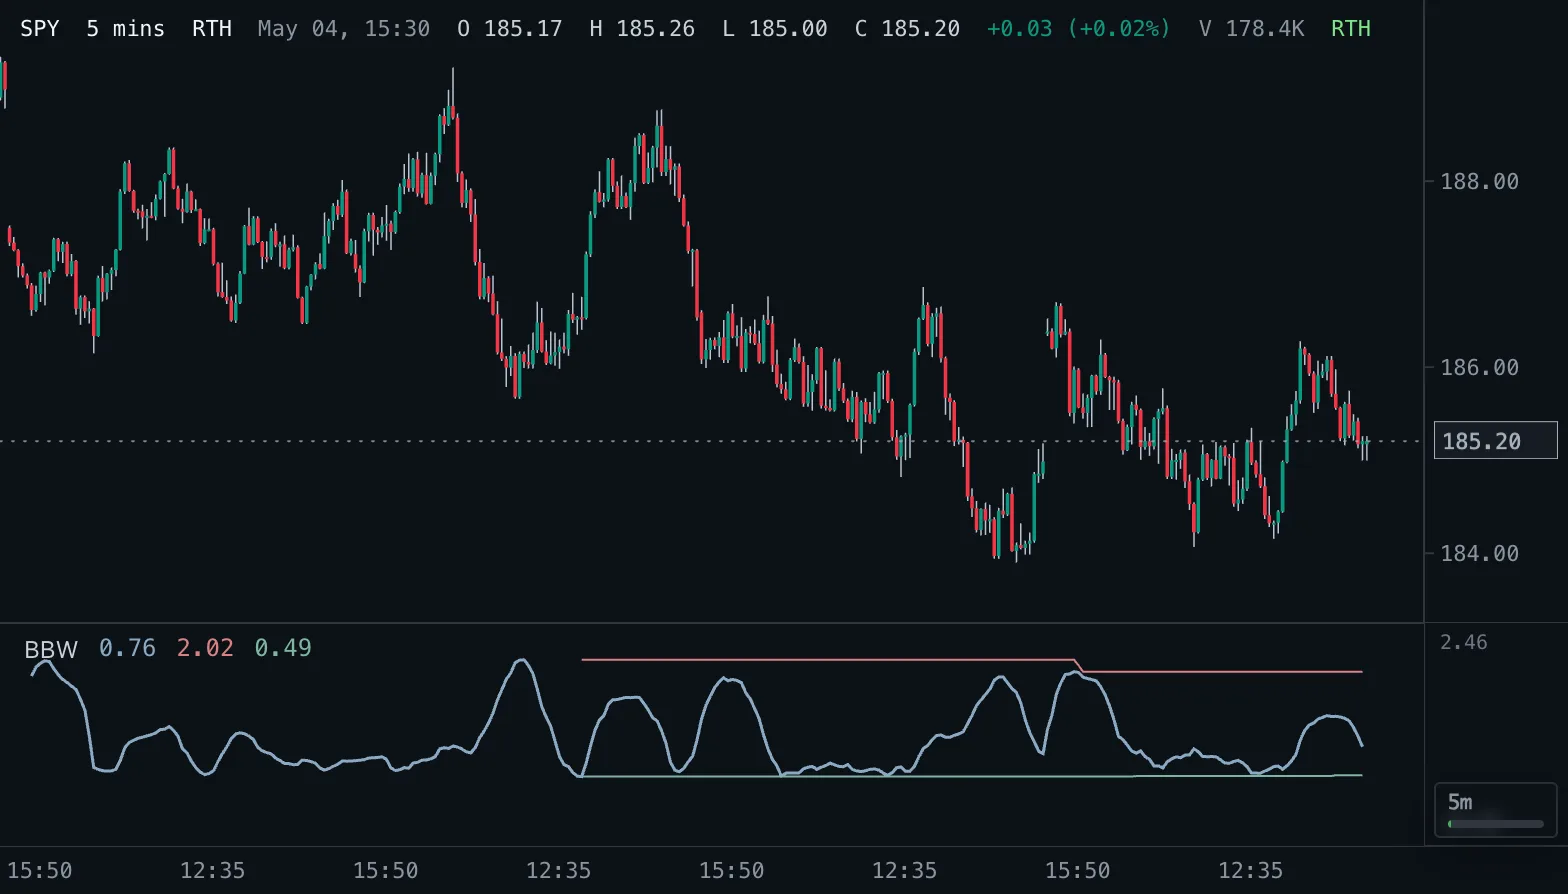
Bollinger BandWidth BBW
The width of the Bollinger Bands as a percentage of the basis, with its highest and lowest value over a longer lookback to spot squeezes.
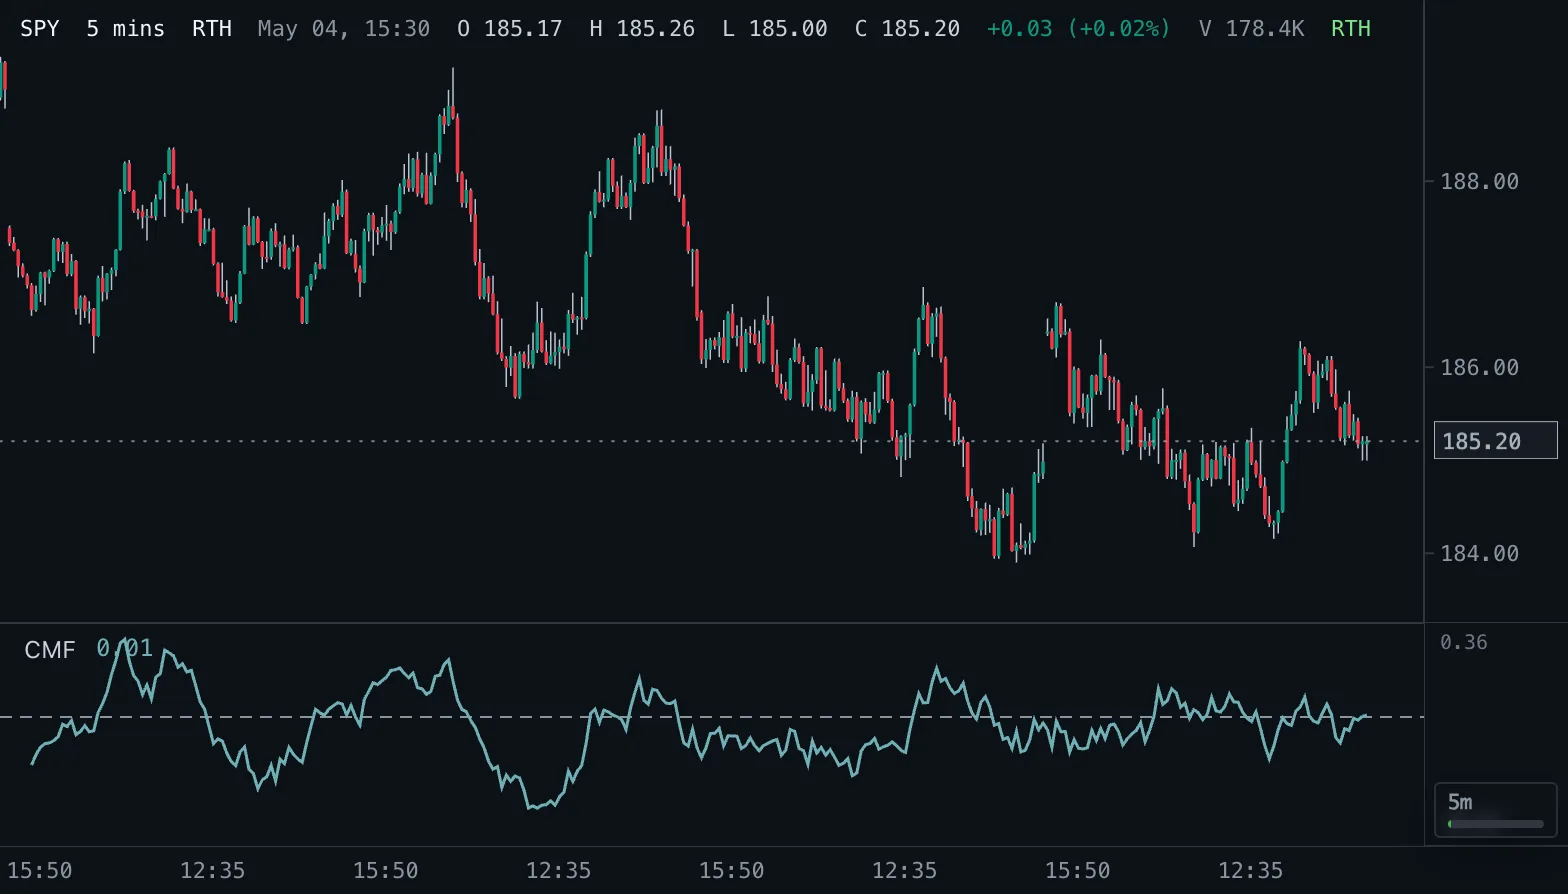
Chaikin Money Flow CMF
Share of volume over the last bars that closed in the upper or lower part of its bar range, from -1 to +1.
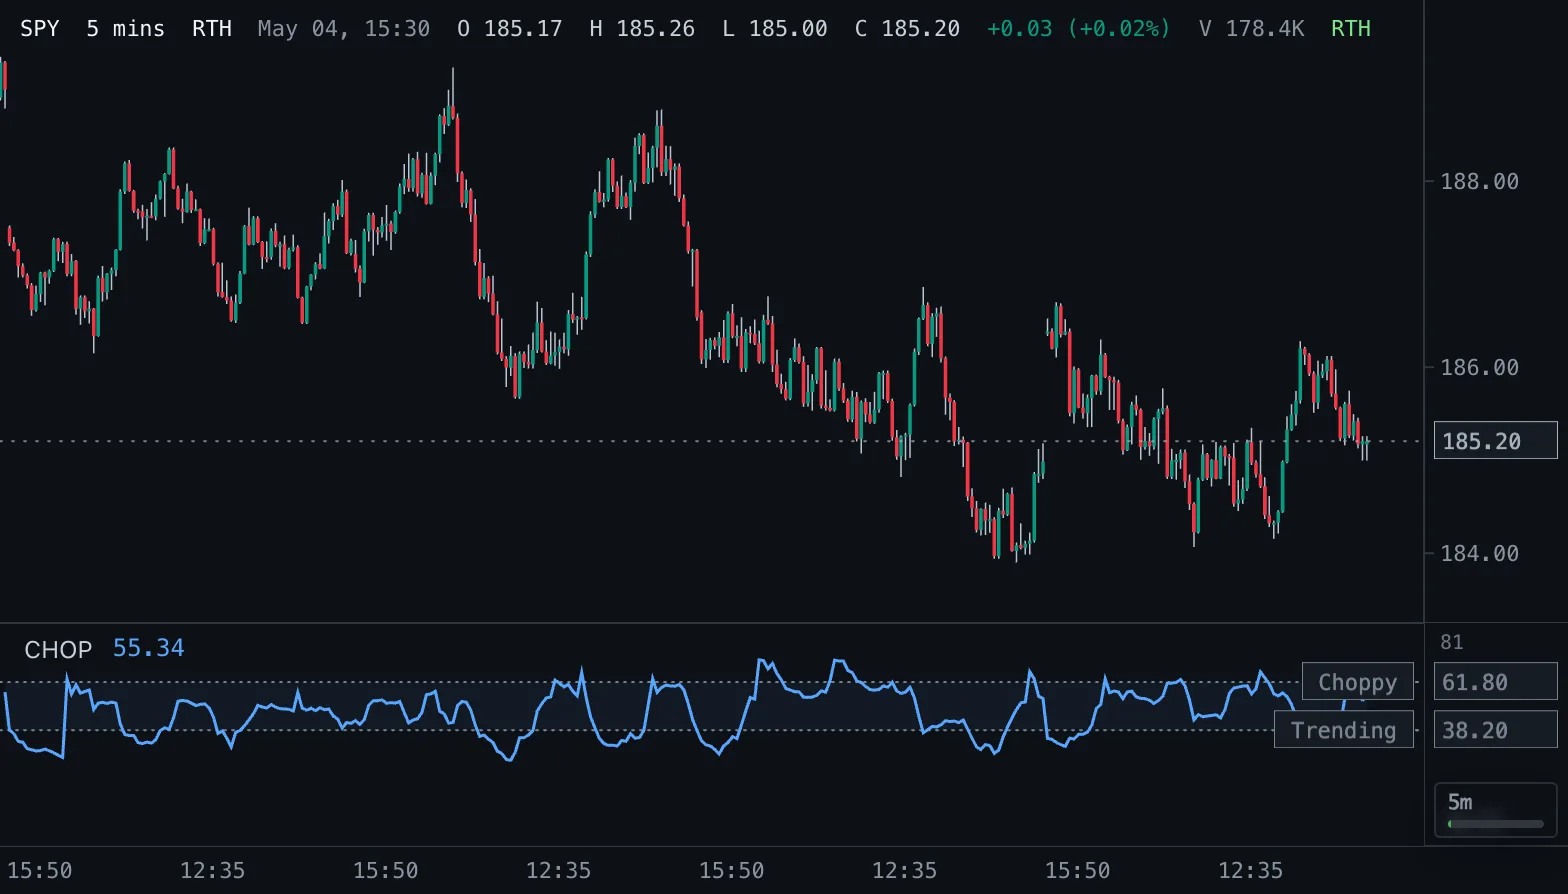
Choppiness Index CHOP
Whether the market trends or chops sideways, on a 0 to 100 scale with the 38.2 and 61.8 guides.
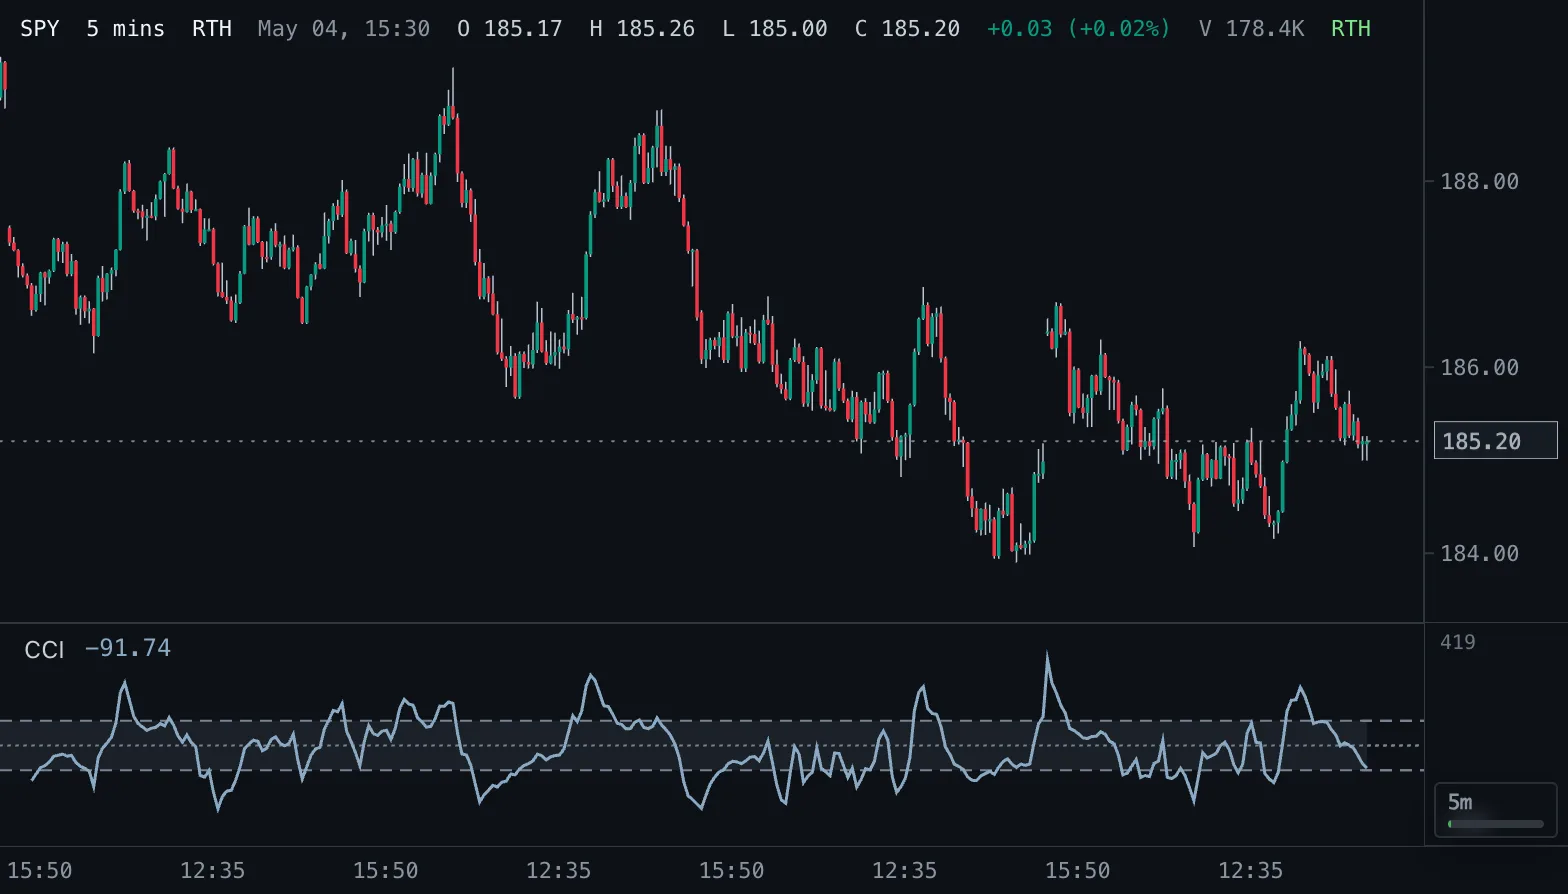
Commodity Channel Index CCI
How far the typical price is from its average, in units of its mean deviation, with +100 and -100 bands.
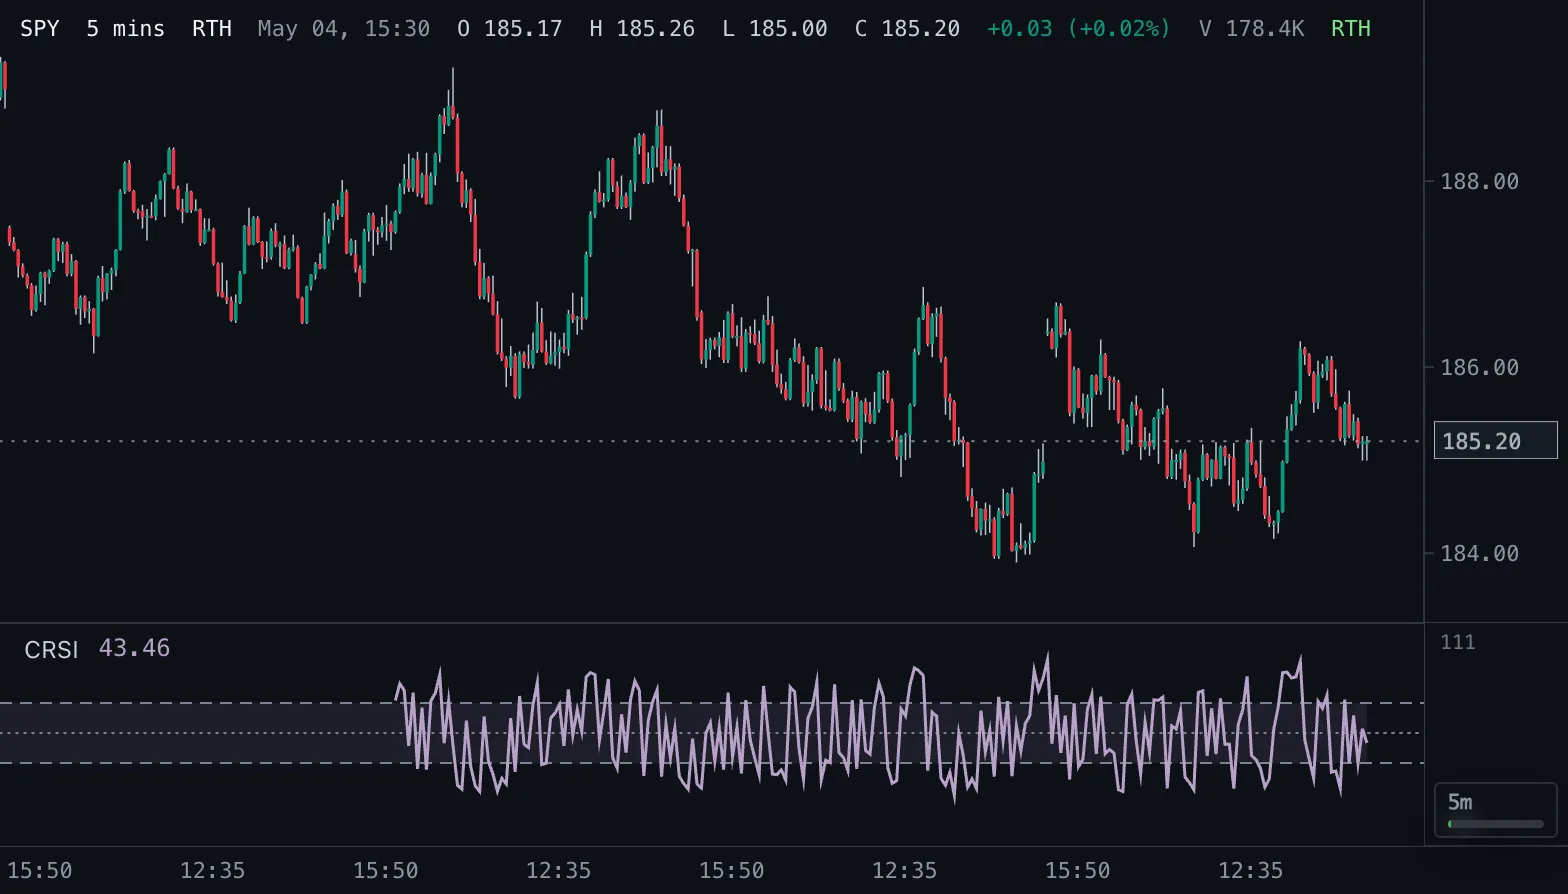
Connors RSI CRSI
The average of a short RSI, an RSI of the up/down streak length and the percent rank of the last change, on a 0-100 scale.
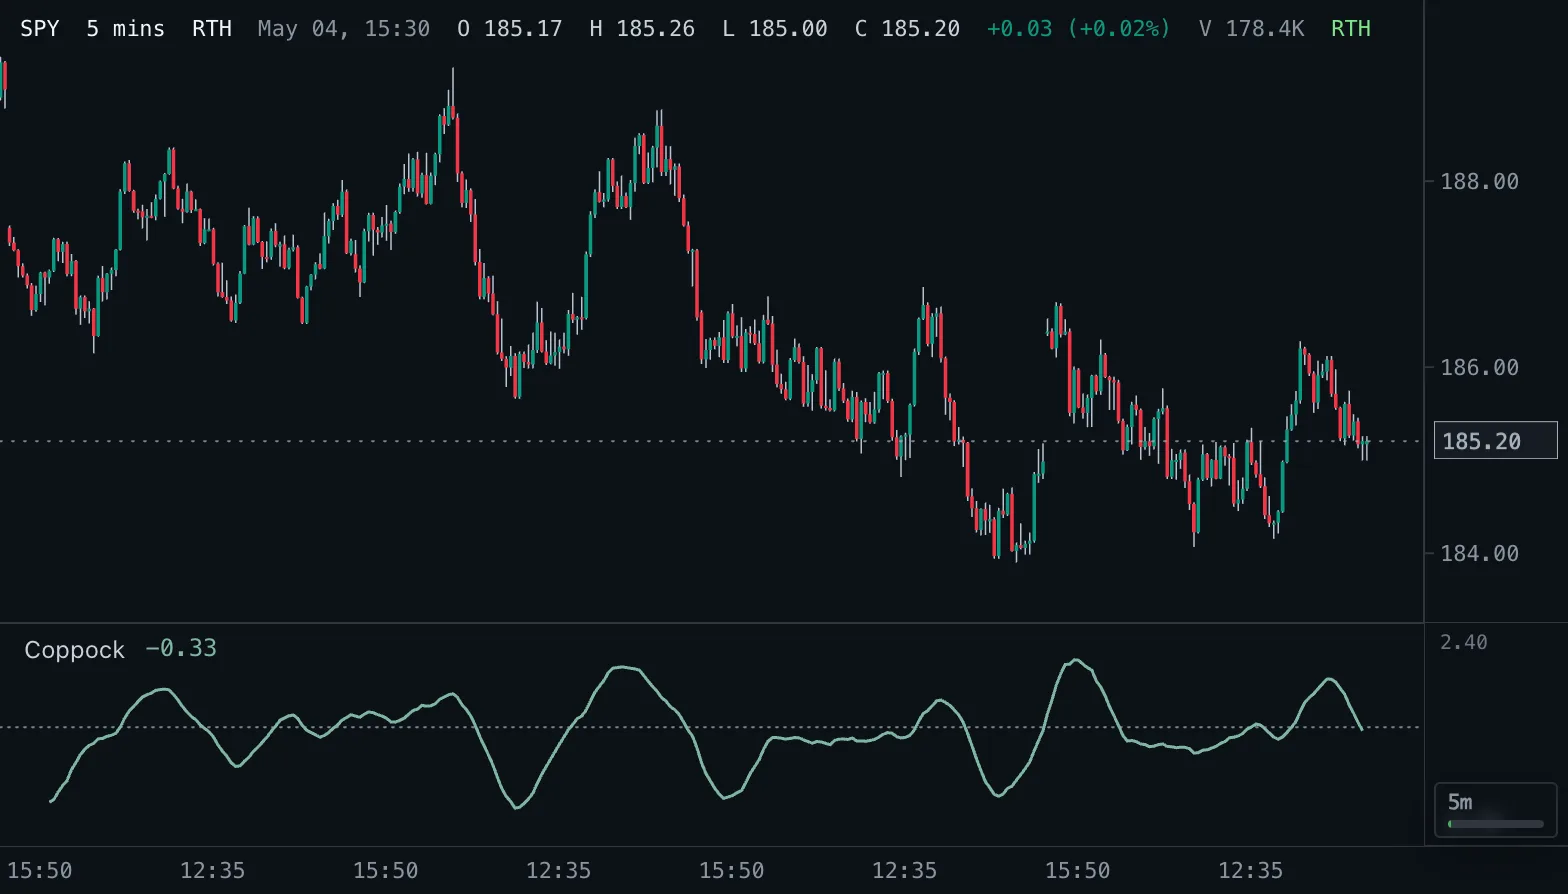
Coppock Curve Coppock
A weighted average of the sum of a long and a short rate of change, around a zero line.
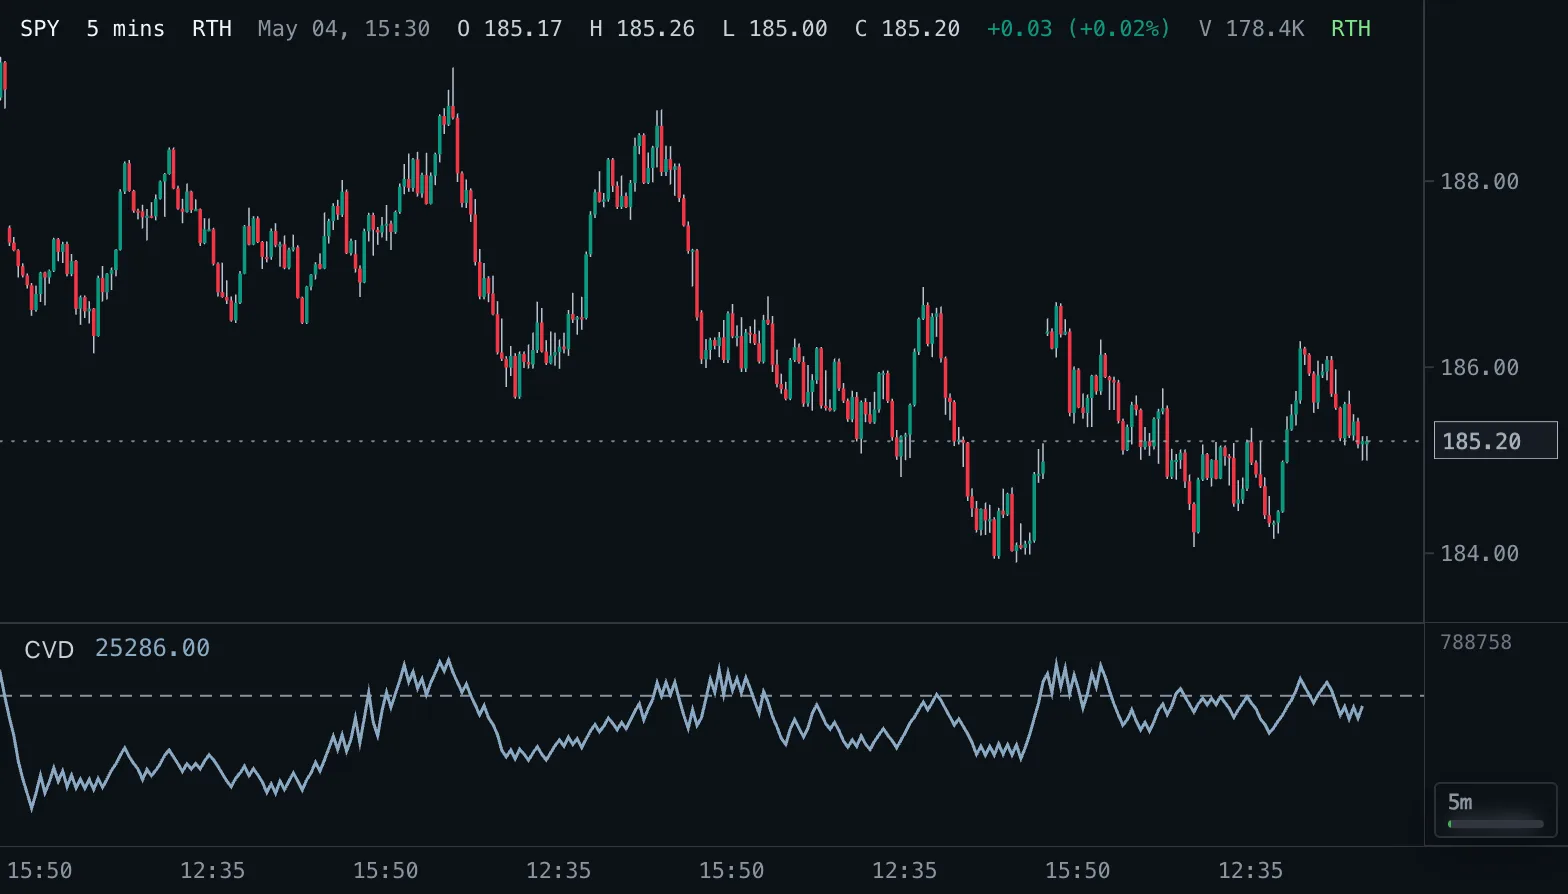
Cumulative Volume Delta CVD
Approximate cumulative volume delta from up and down bars: volume of rising bars minus volume of falling bars, summed.
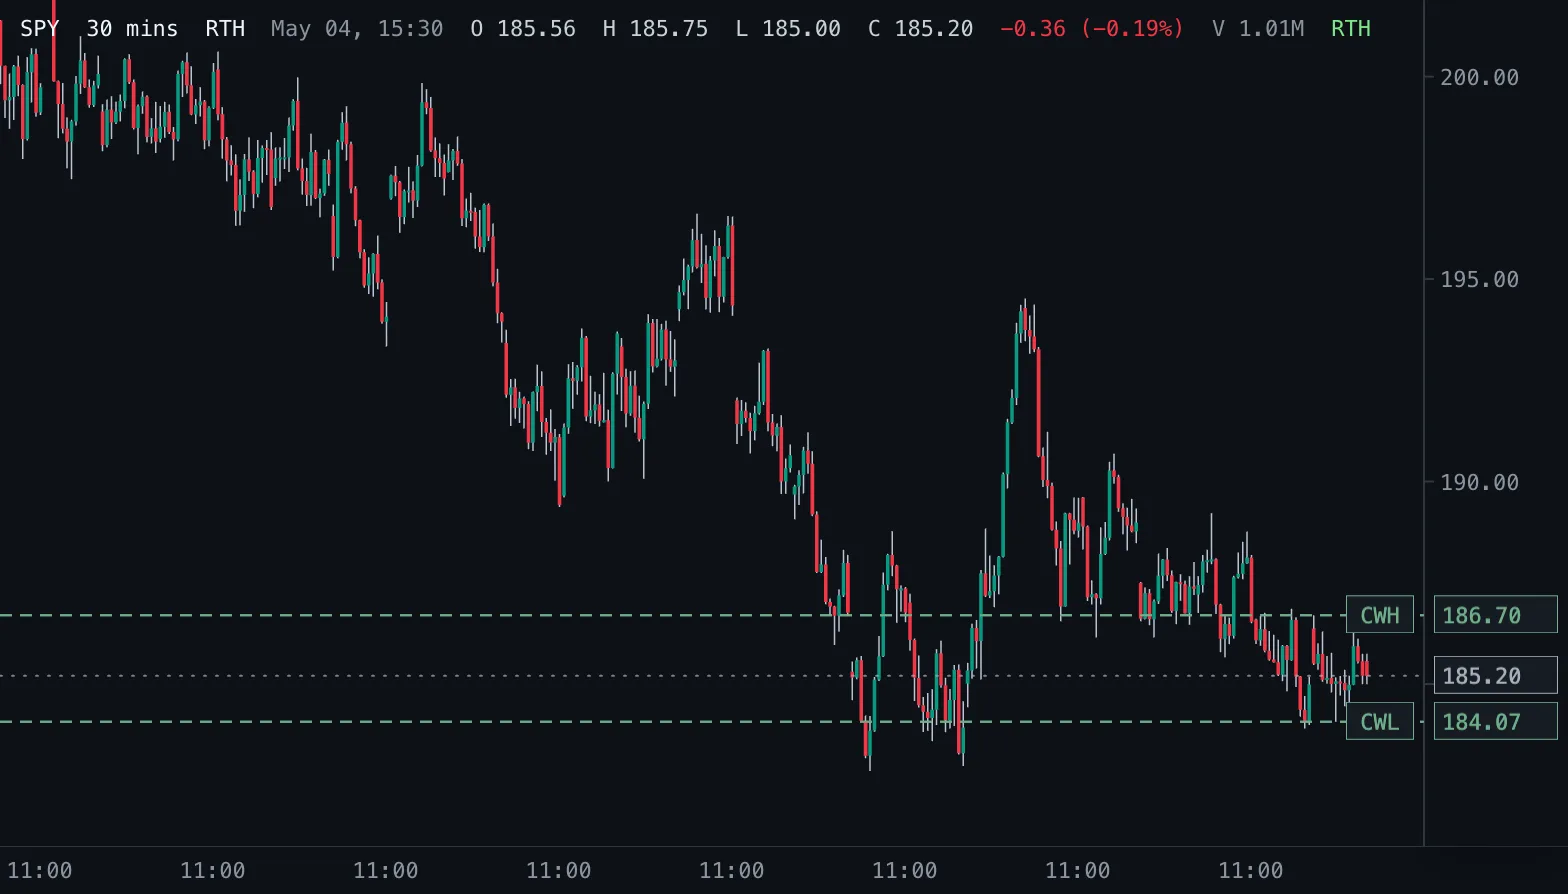
Current Week High/Low CWx
Developing high and low of the current trading week as horizontal levels, with optional history.
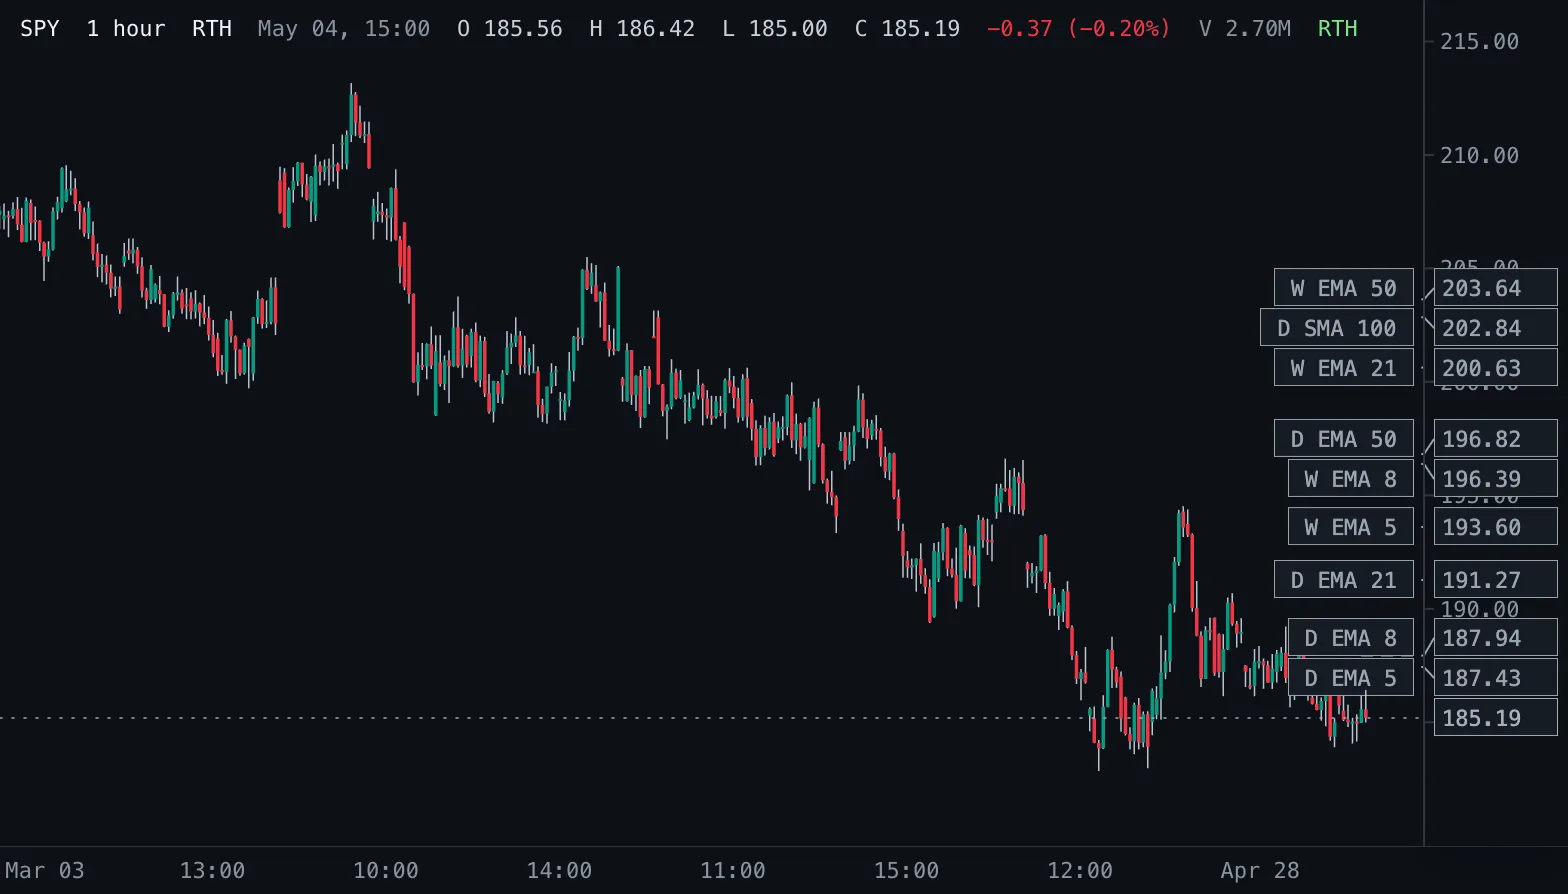
Daily & Weekly EMA Levels D/W EMA
Latest daily EMA 5/8/21/50 and SMA 100 and weekly EMA 5/8/21/50 as levels on any chart, read from daily and weekly bars.
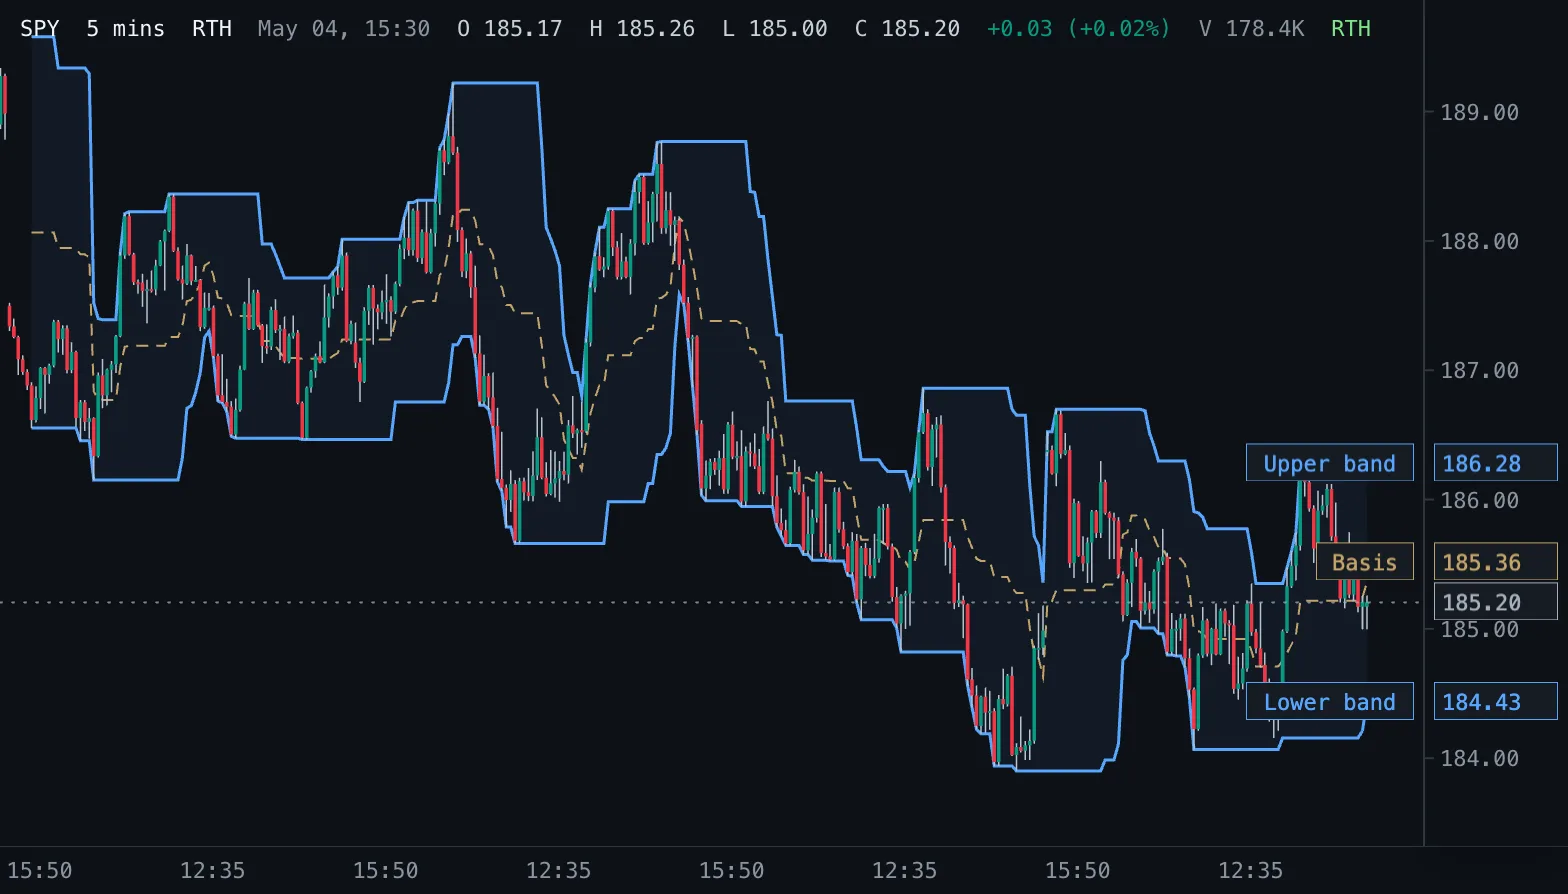
Donchian Channels DC
The highest high and the lowest low of the last bars, with their midpoint: the range price has traded in.
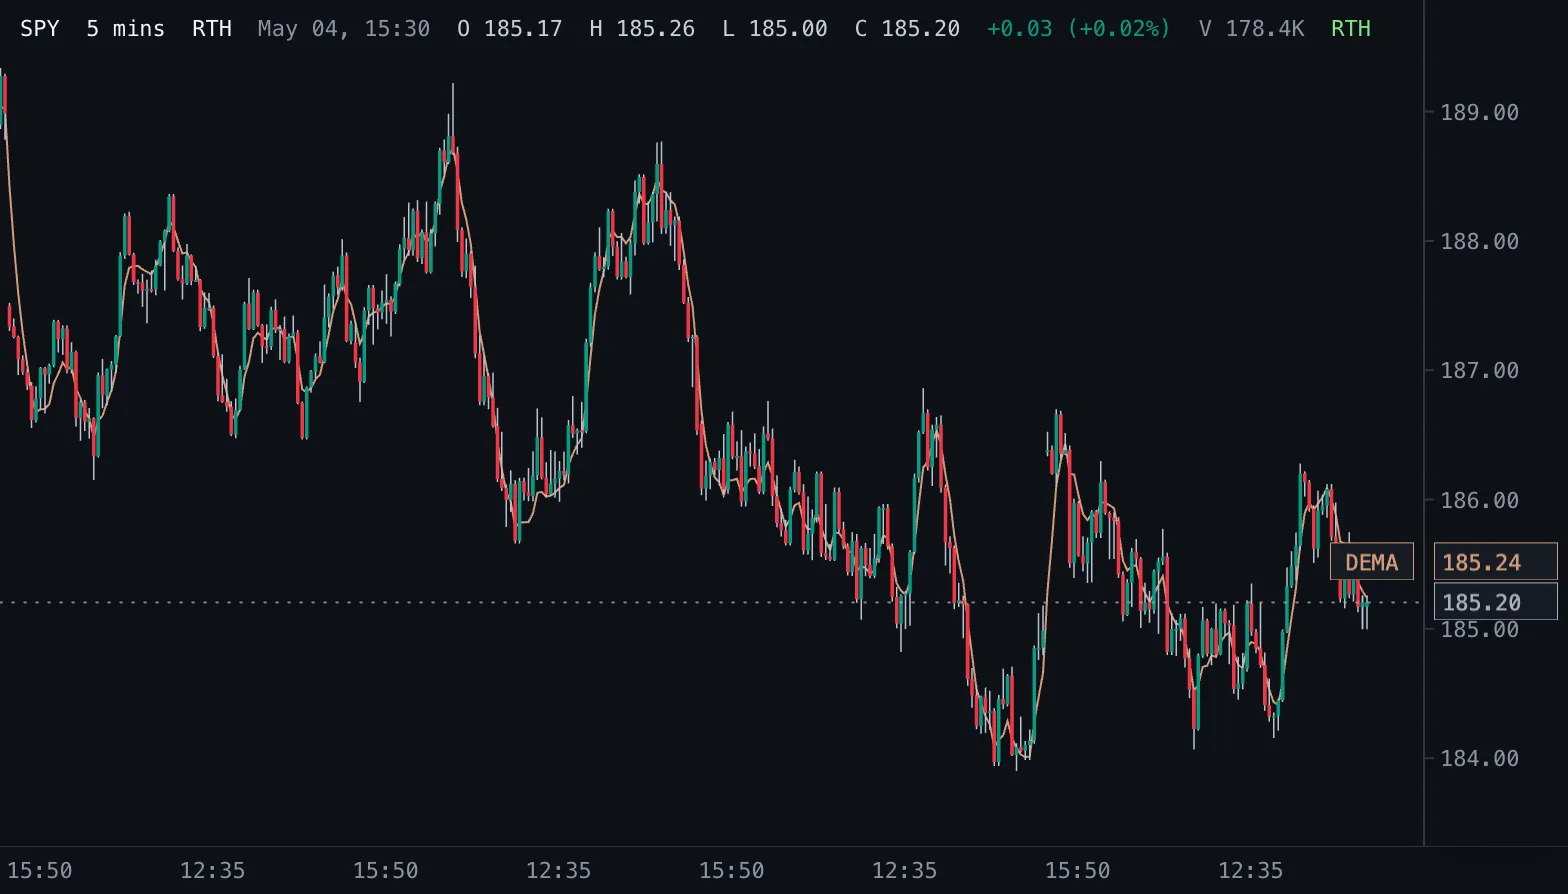
Double Exponential Moving Average DEMA
Patrick Mulloy's double exponential moving average: an EMA with most of its lag removed, drawn on the candles.
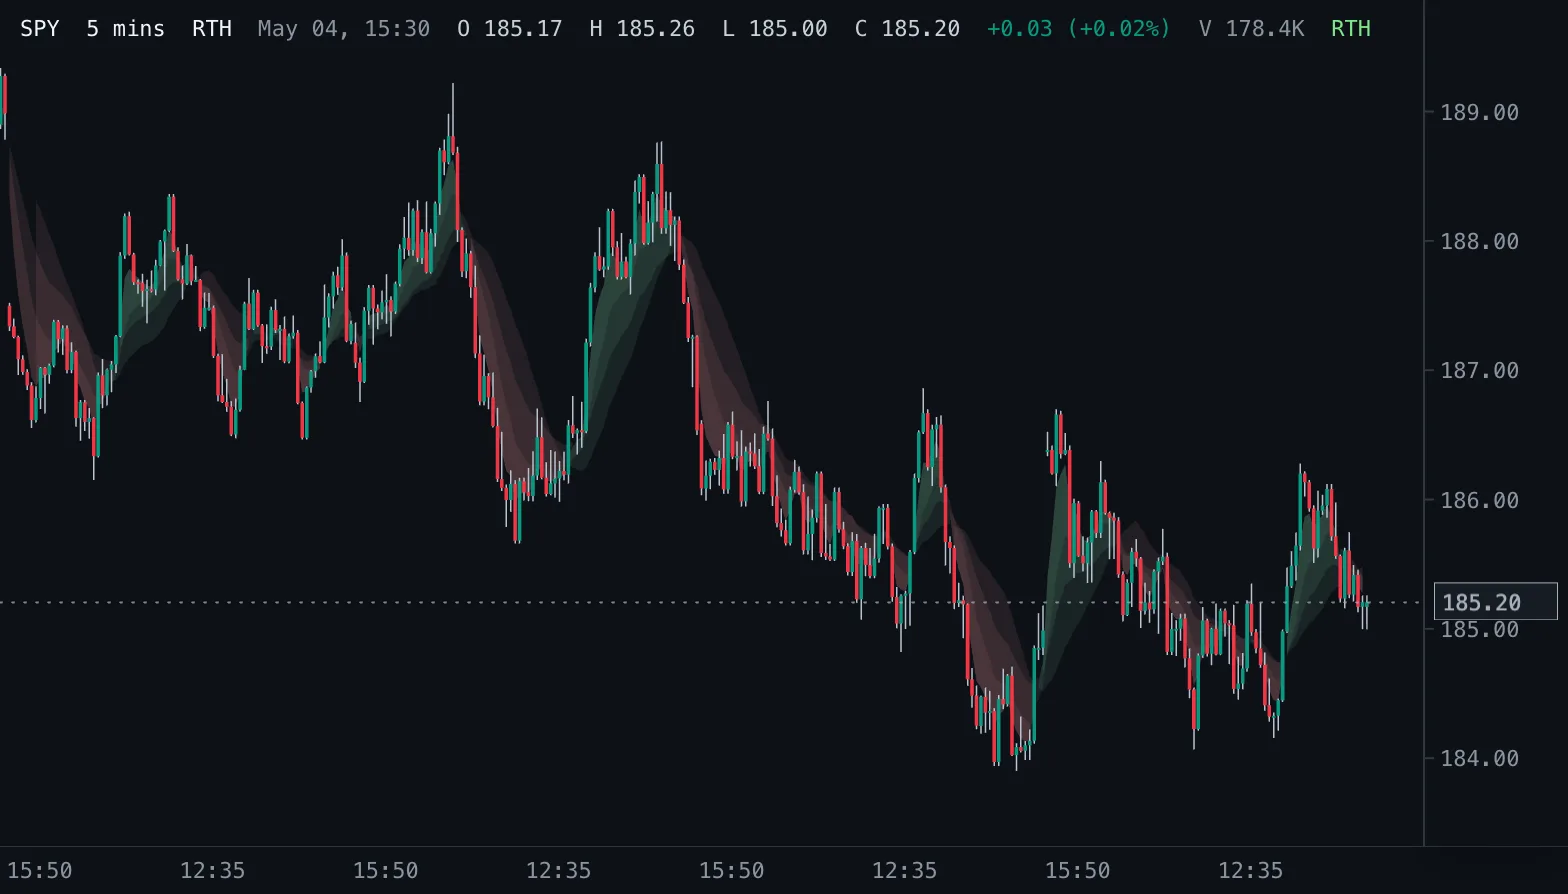
EMA Clouds EMA Clouds
Shaded bullish and bearish clouds between EMA 4 and three slower averages: EMA 20, SMA 21 and EMA 10.
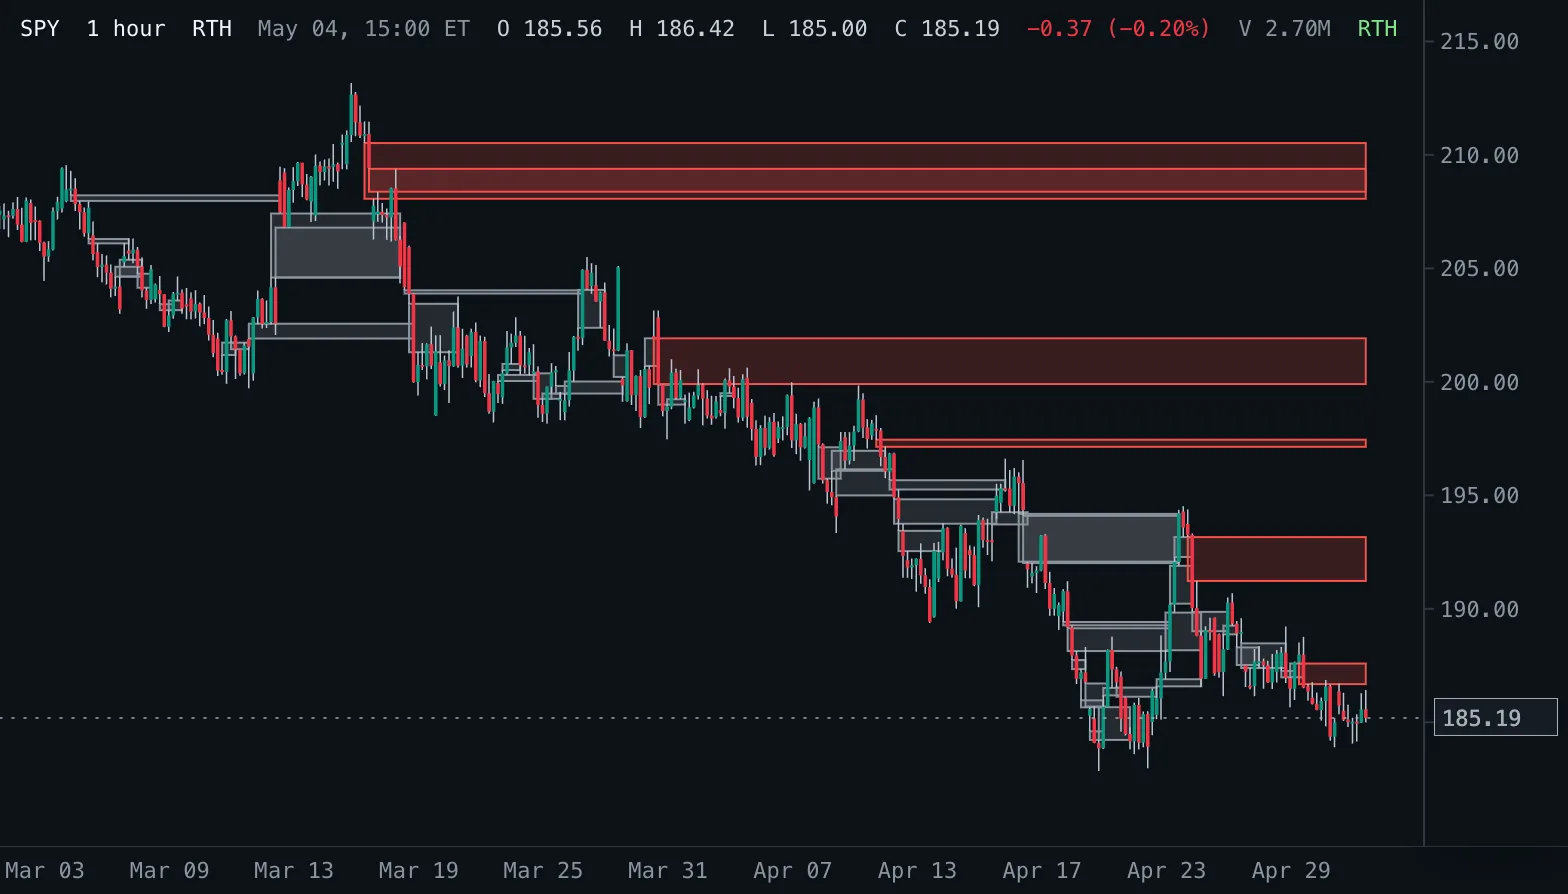
Fair Value Gaps FVG
Boxes every three-bar fair value gap from its first bar until price fills (or touches) it, labelled with the gap size; hovering a box shows its size in percent and whether it is still open.
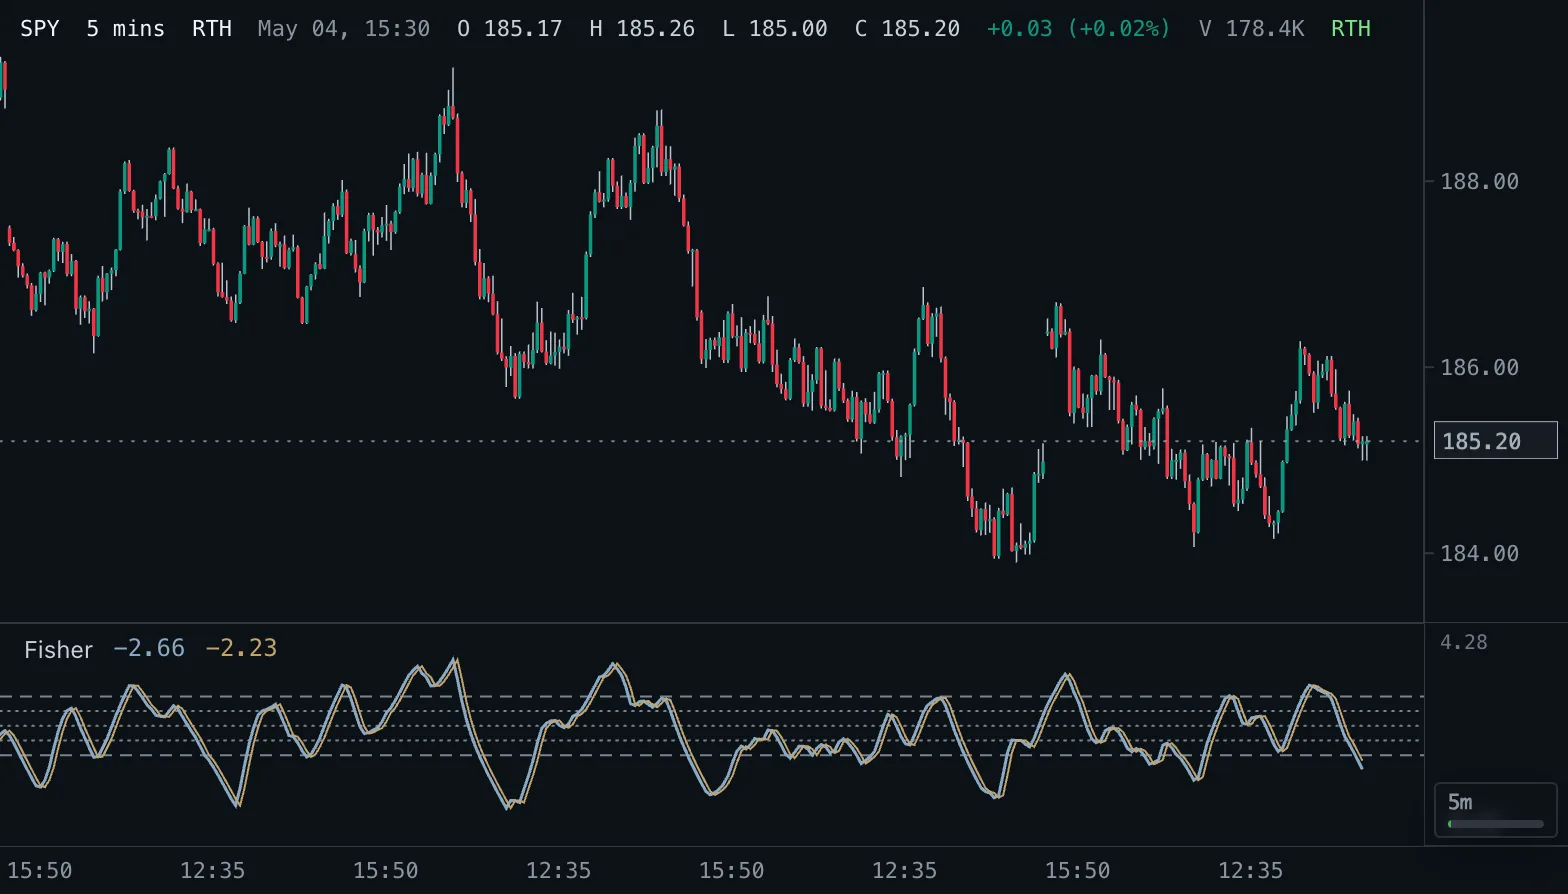
Fisher Transform Fisher
Ehlers' Fisher Transform of the median price's position in its recent range, with a one-bar trigger line.
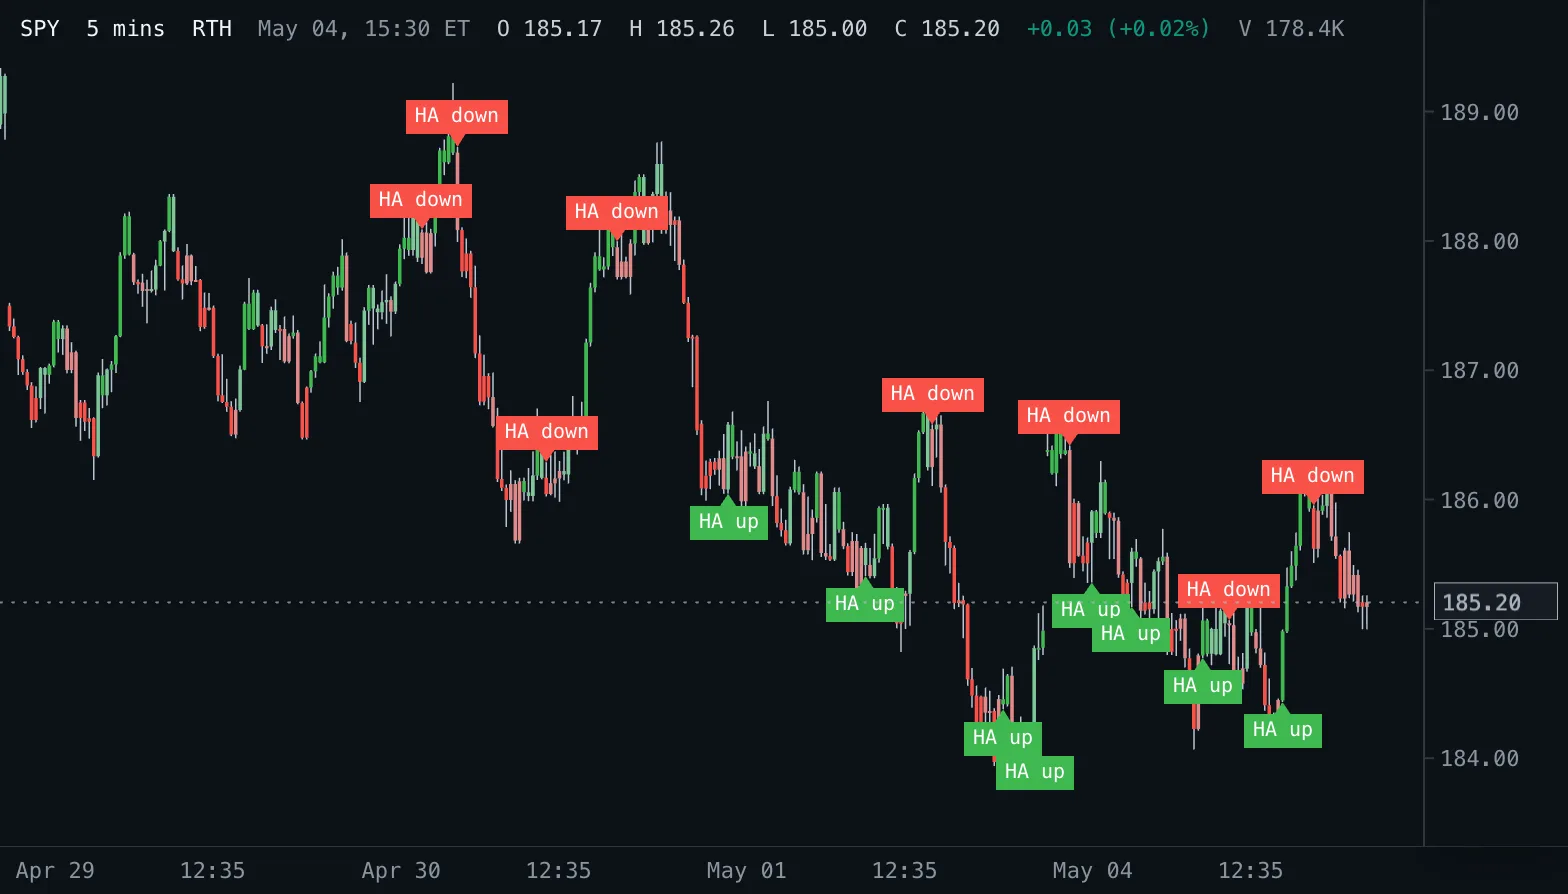
Heikin-Ashi Bar Coloring HA Colors
Colours the chart's candles by the Heikin-Ashi trend while they keep their true prices, marks the strong Heikin-Ashi bars without a counter shadow, and labels every turn.
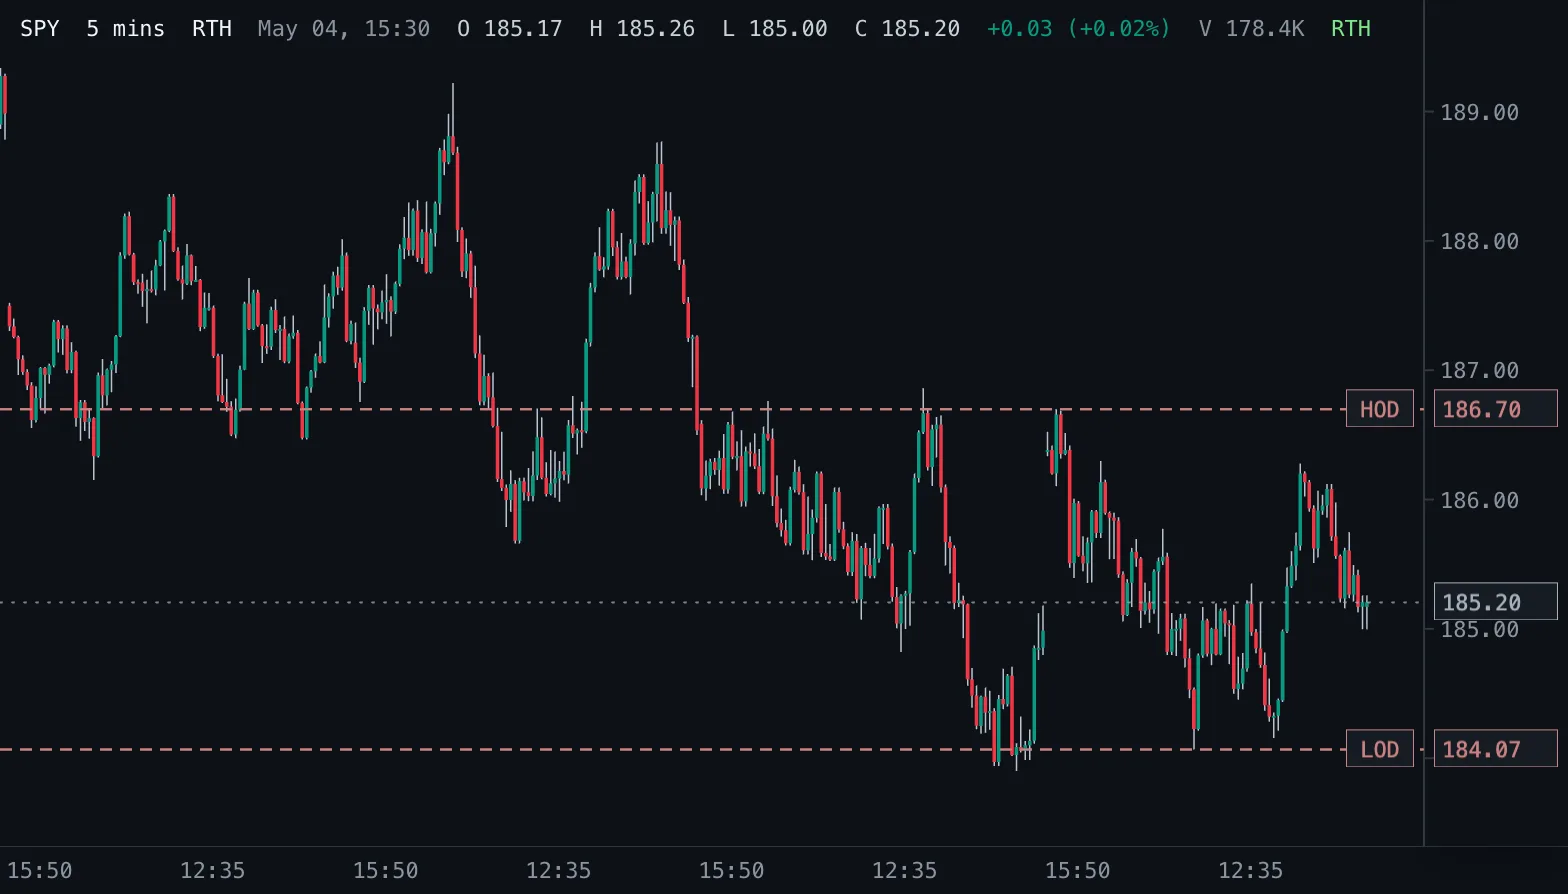
High/Low of Day HOD/L
Developing high and low of the current regular session as labeled levels, with optional history.
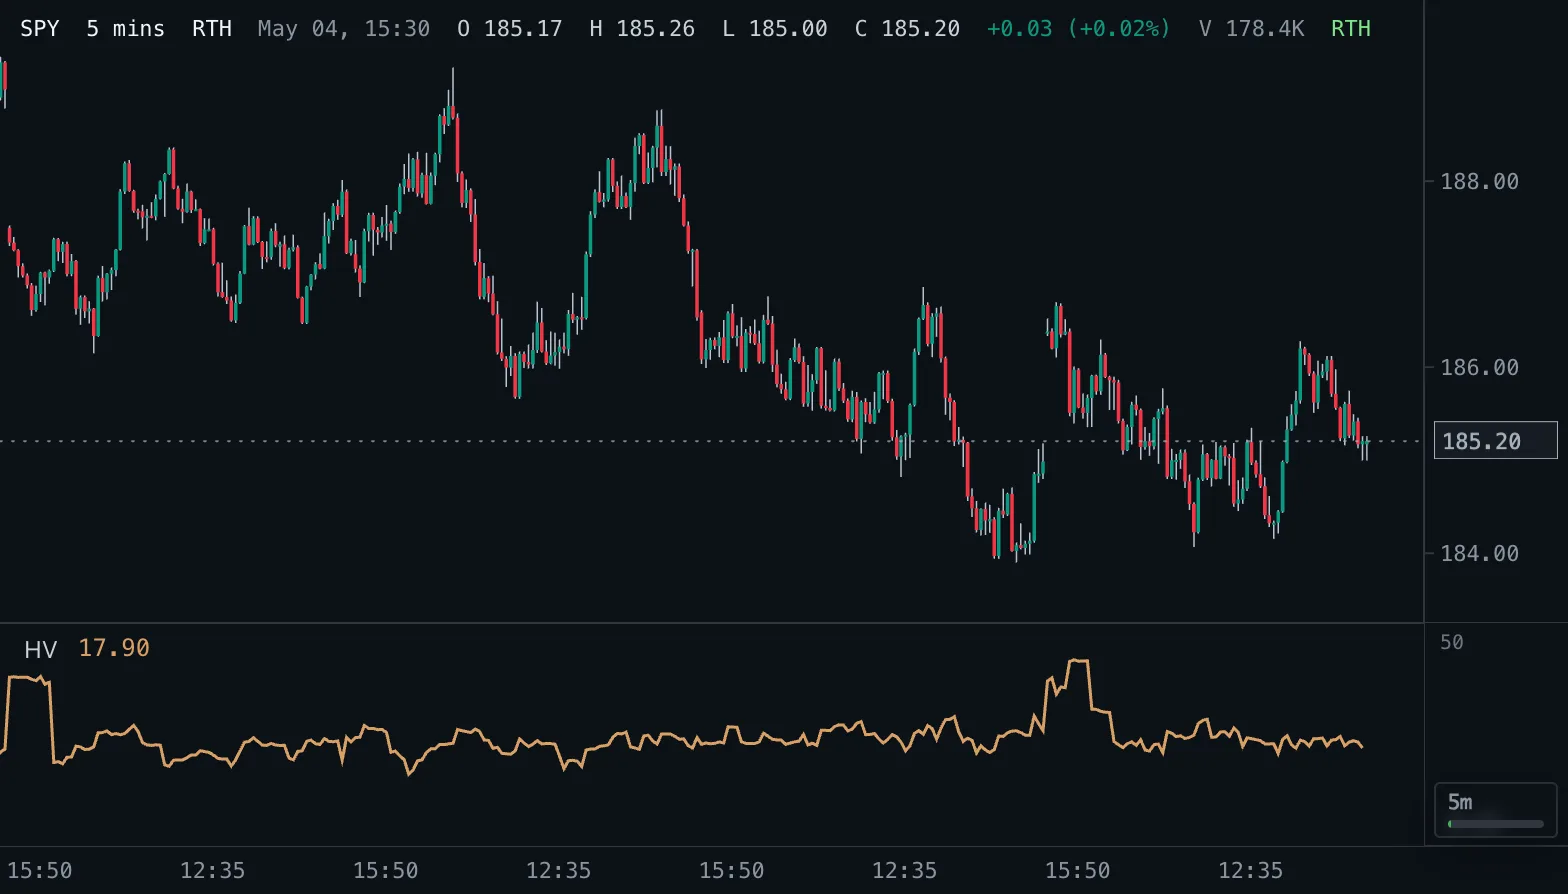
Historical Volatility HV
Annualised standard deviation of log returns in percent, scaled correctly for the chart's bar size.
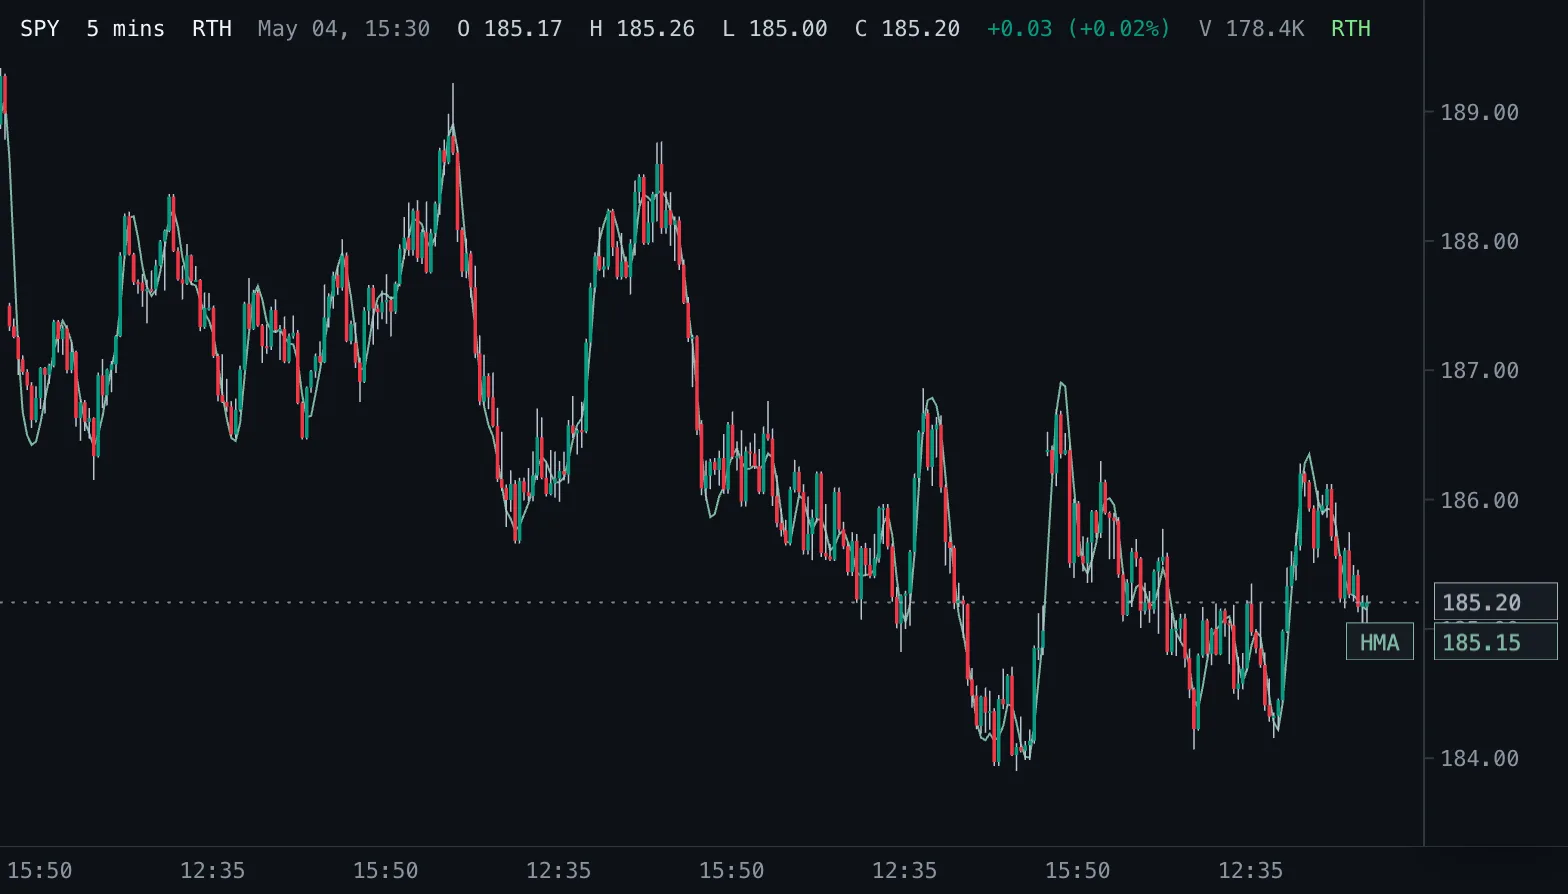
Hull Moving Average HMA
Alan Hull's moving average: a smooth line with very little lag, built from weighted averages, drawn on the candles.
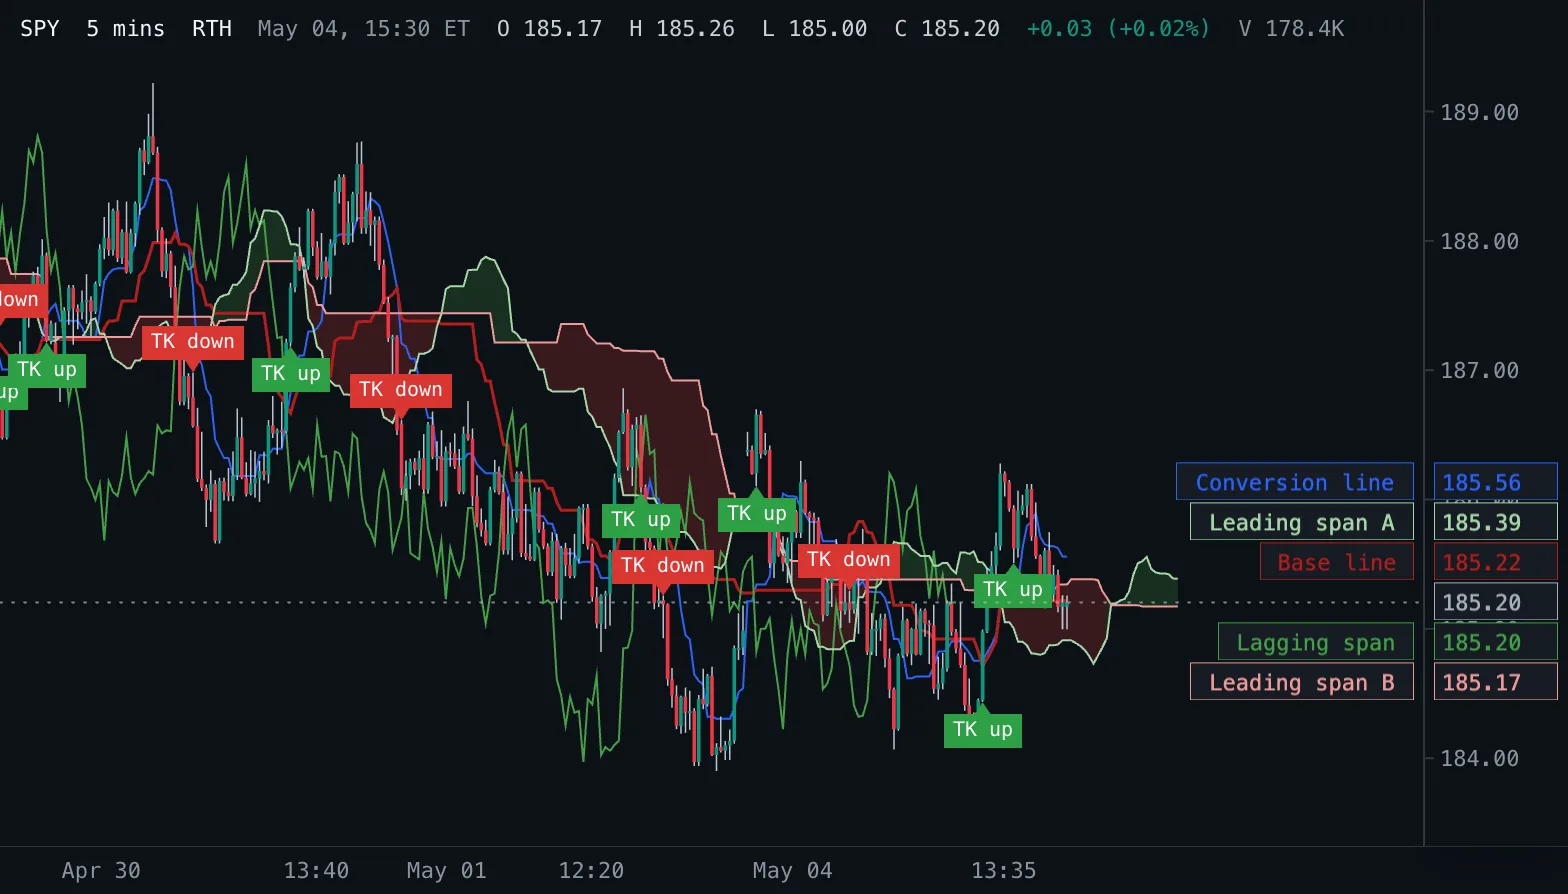
Ichimoku Cloud Colored Ichimoku
Ichimoku Kinko Hyo with one cloud coloured bar by bar (green where leading span A is above B, red elsewhere) and a label at every Tenkan/Kijun cross.
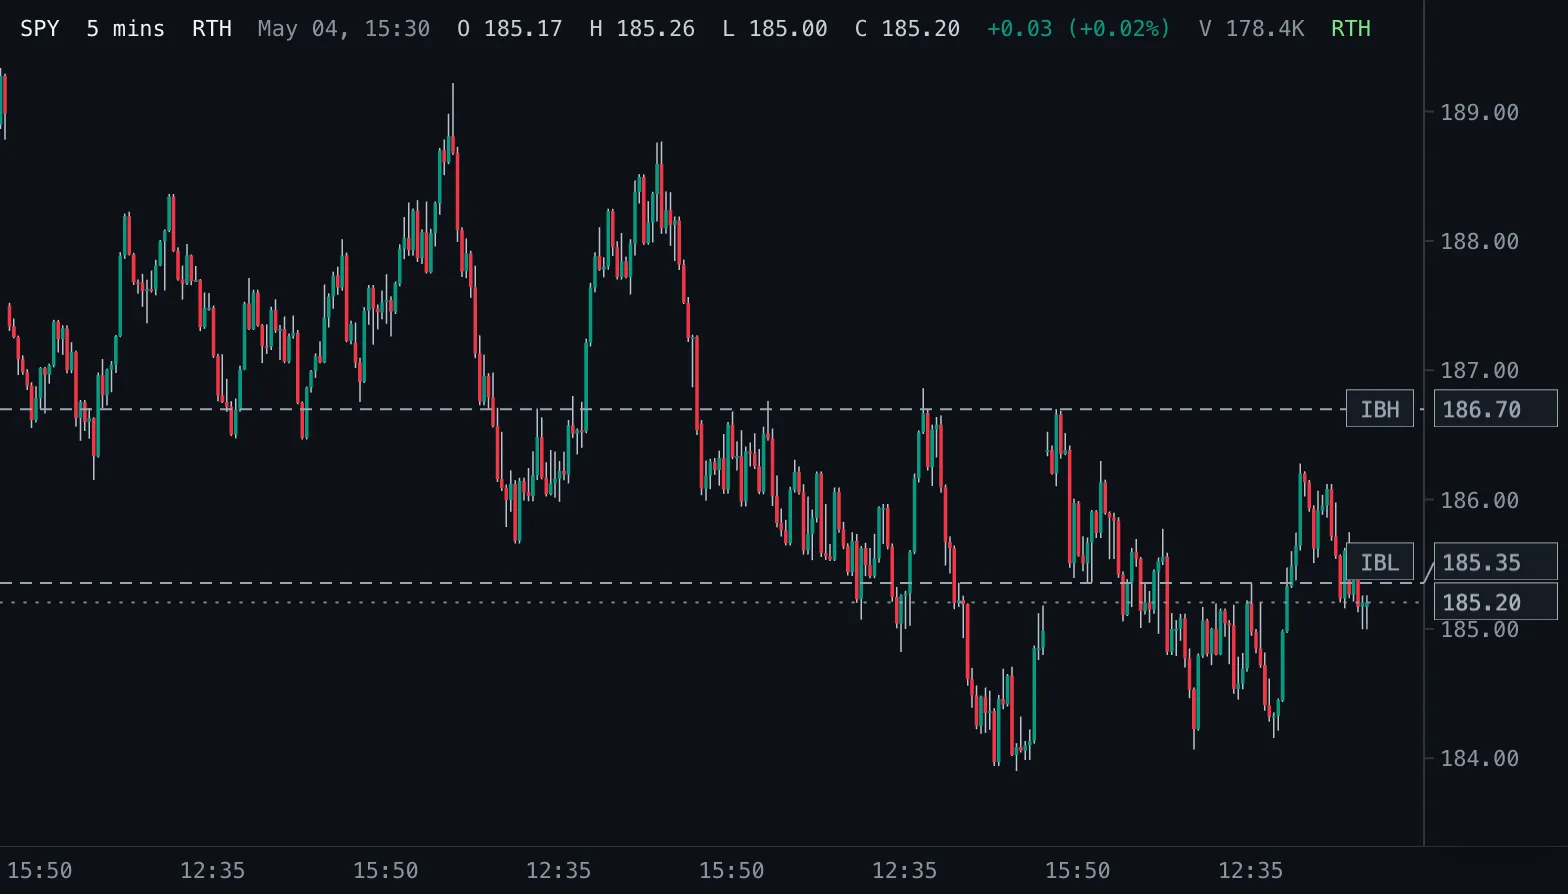
Initial Balance IB
High (IBH) and low (IBL) of the opening period of the New York regular session, drawn once the period completes.
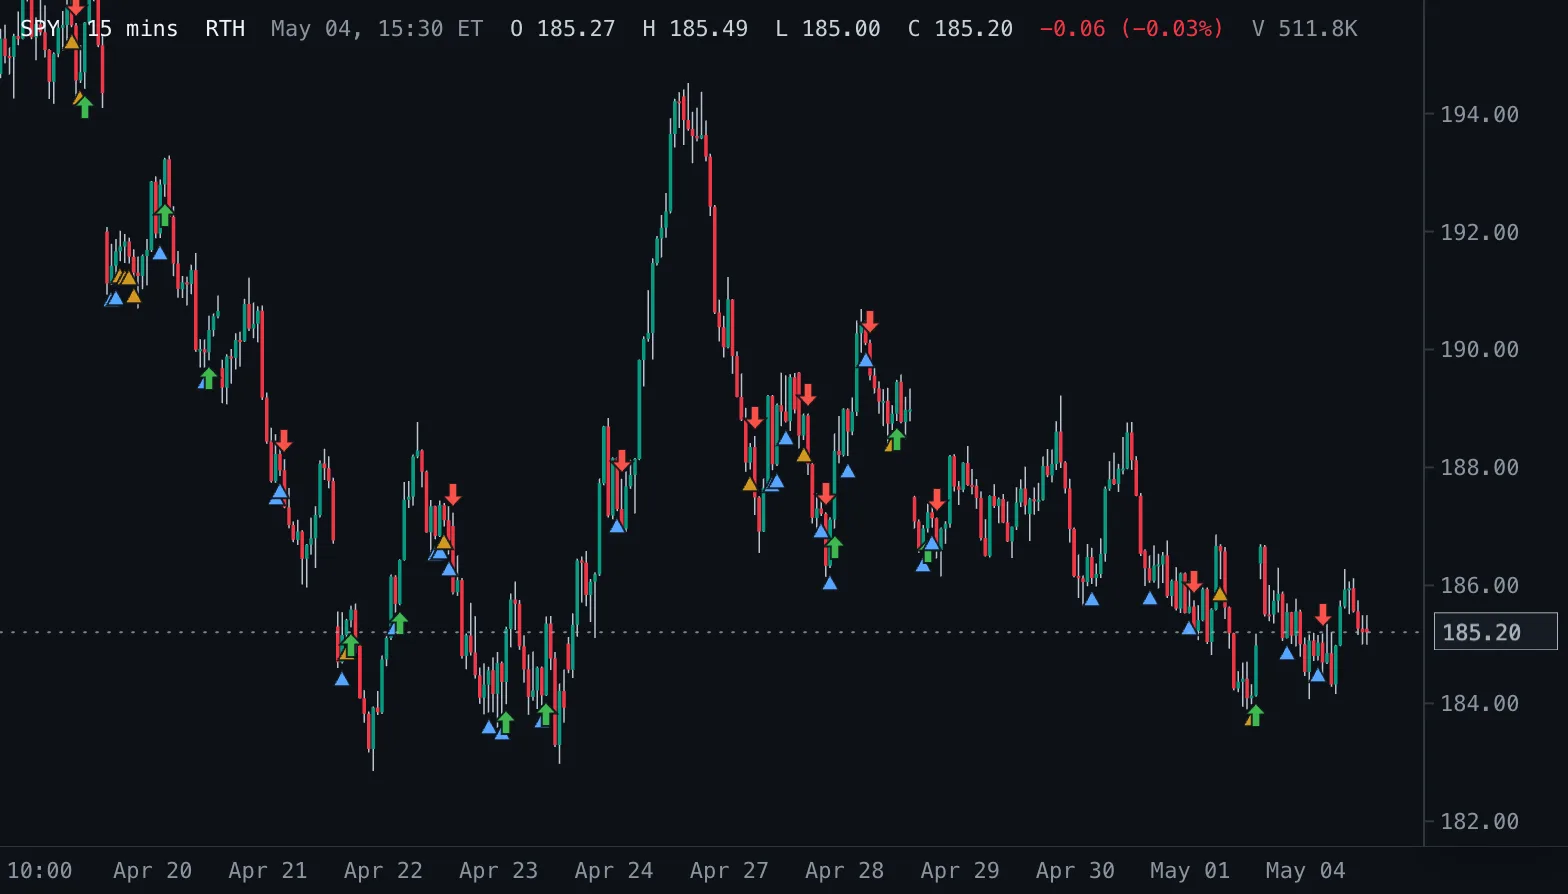
Inside Bar Breakouts IB Break
Marks inside bars with a triangle below the bar and the first close beyond the mother bar with an arrow.
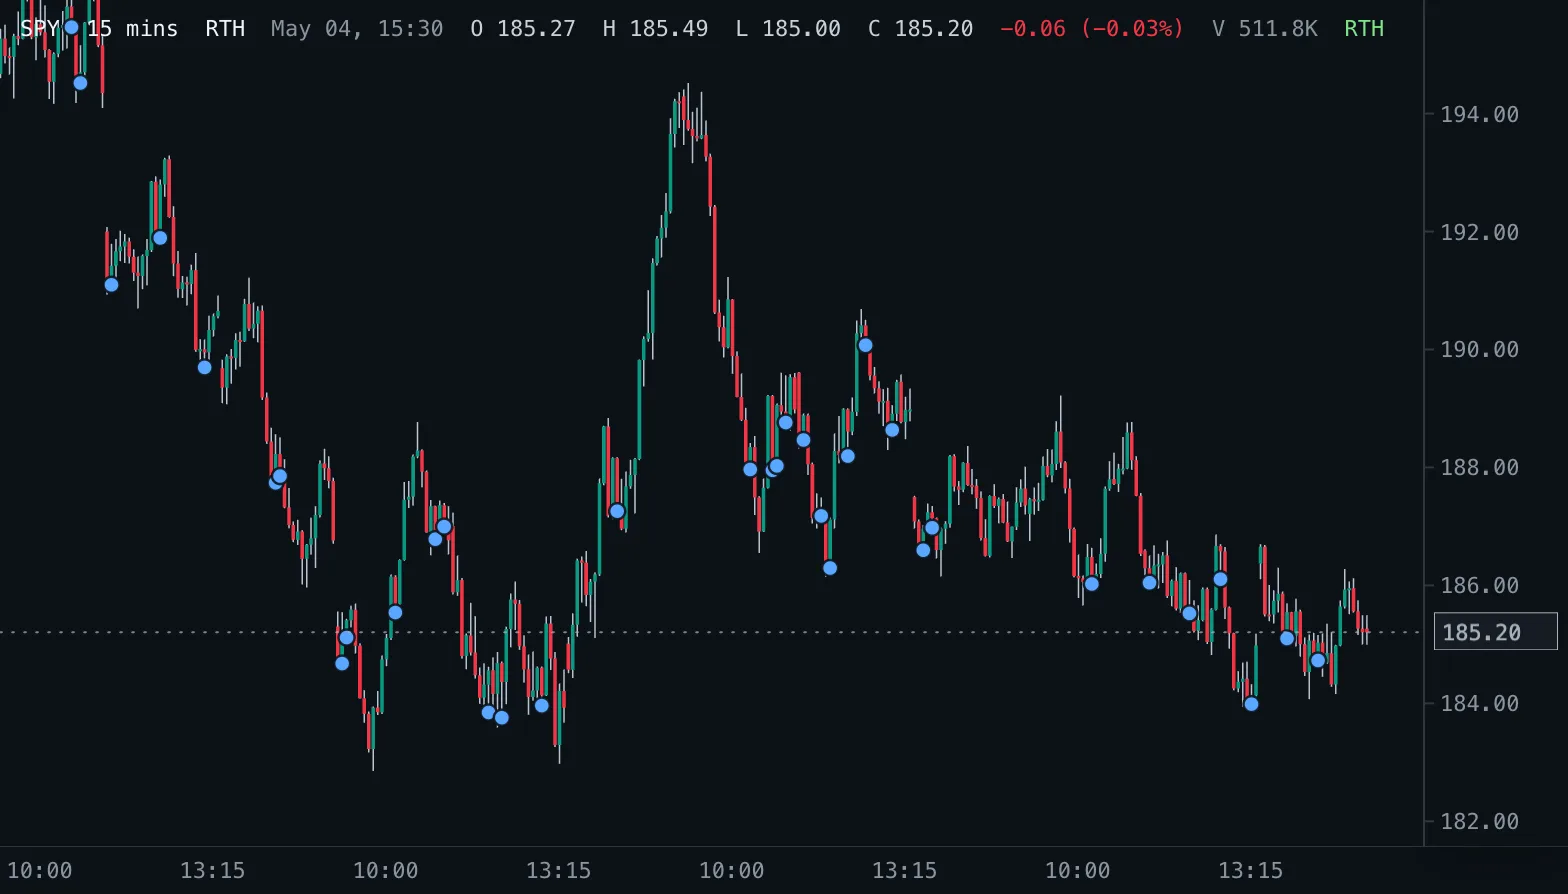
Inside Bars IB
Marks completed bars whose high and low sit inside the previous bar.
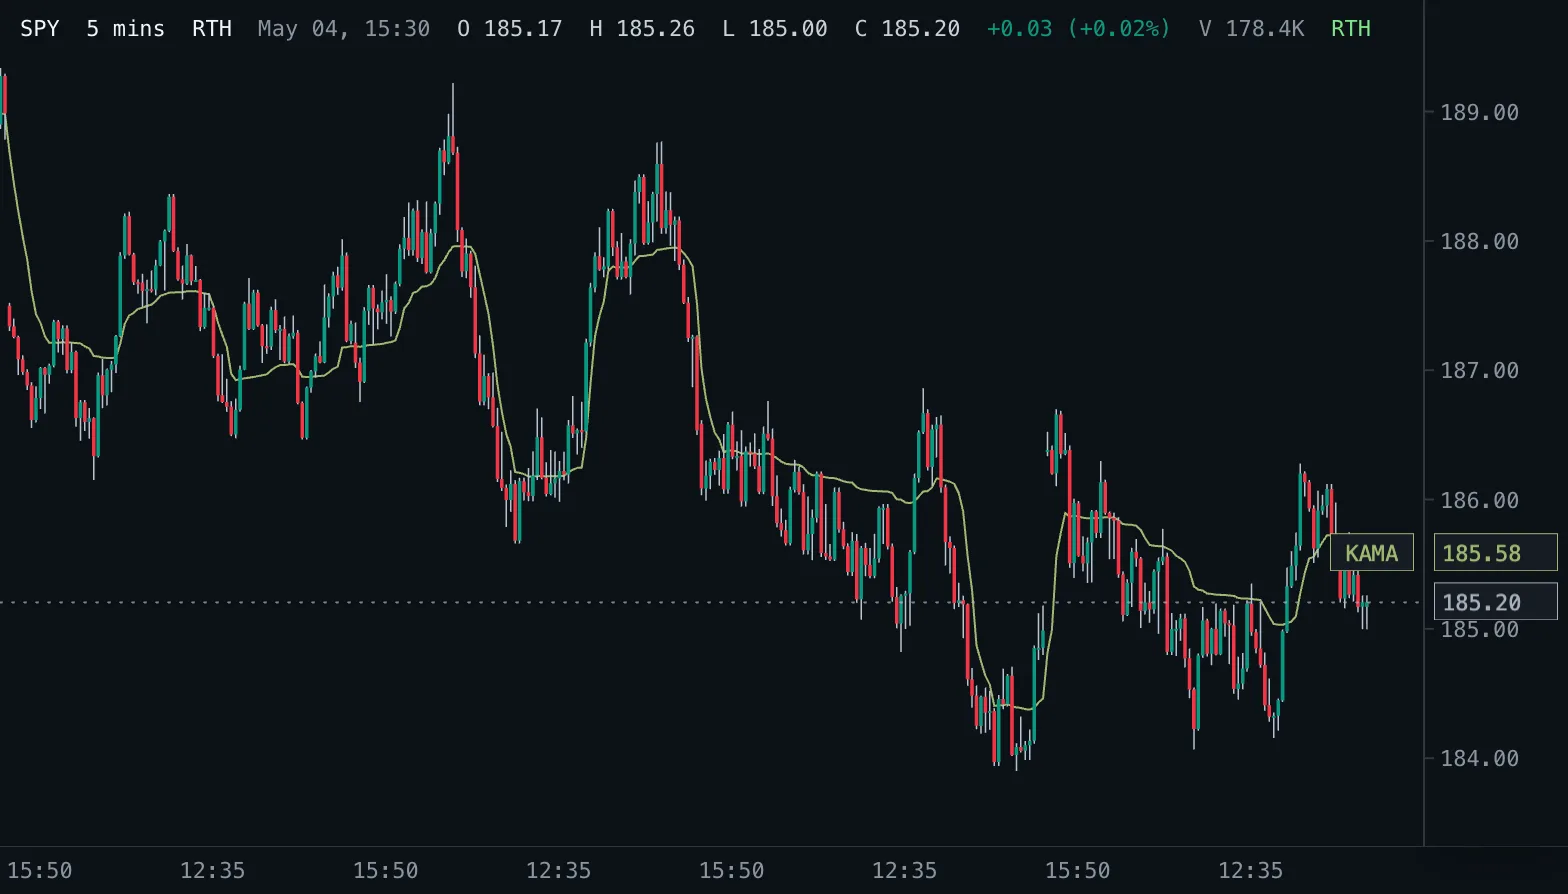
Kaufman Adaptive Moving Average KAMA
Perry Kaufman's adaptive moving average: fast when price trends cleanly, nearly flat when it chops, drawn on the candles.
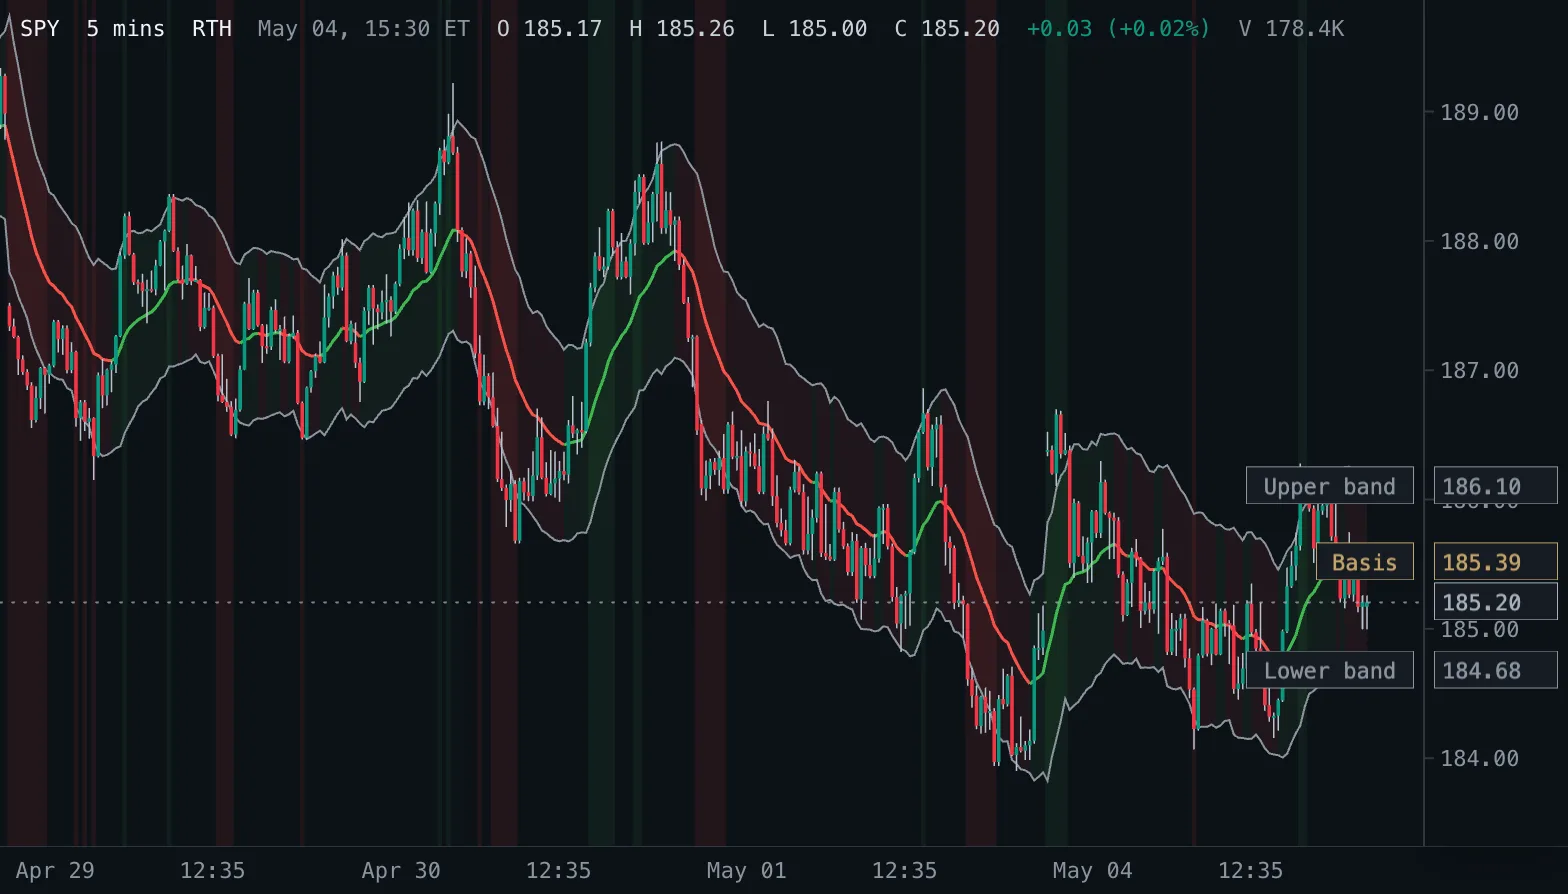
Keltner Channel Trend Shading KC Trend
Keltner Channels (EMA 20 +/- 2 ATR 10) with the basis and channel coloured by the direction of the EMA and the pane shaded where a bar closes outside the bands.
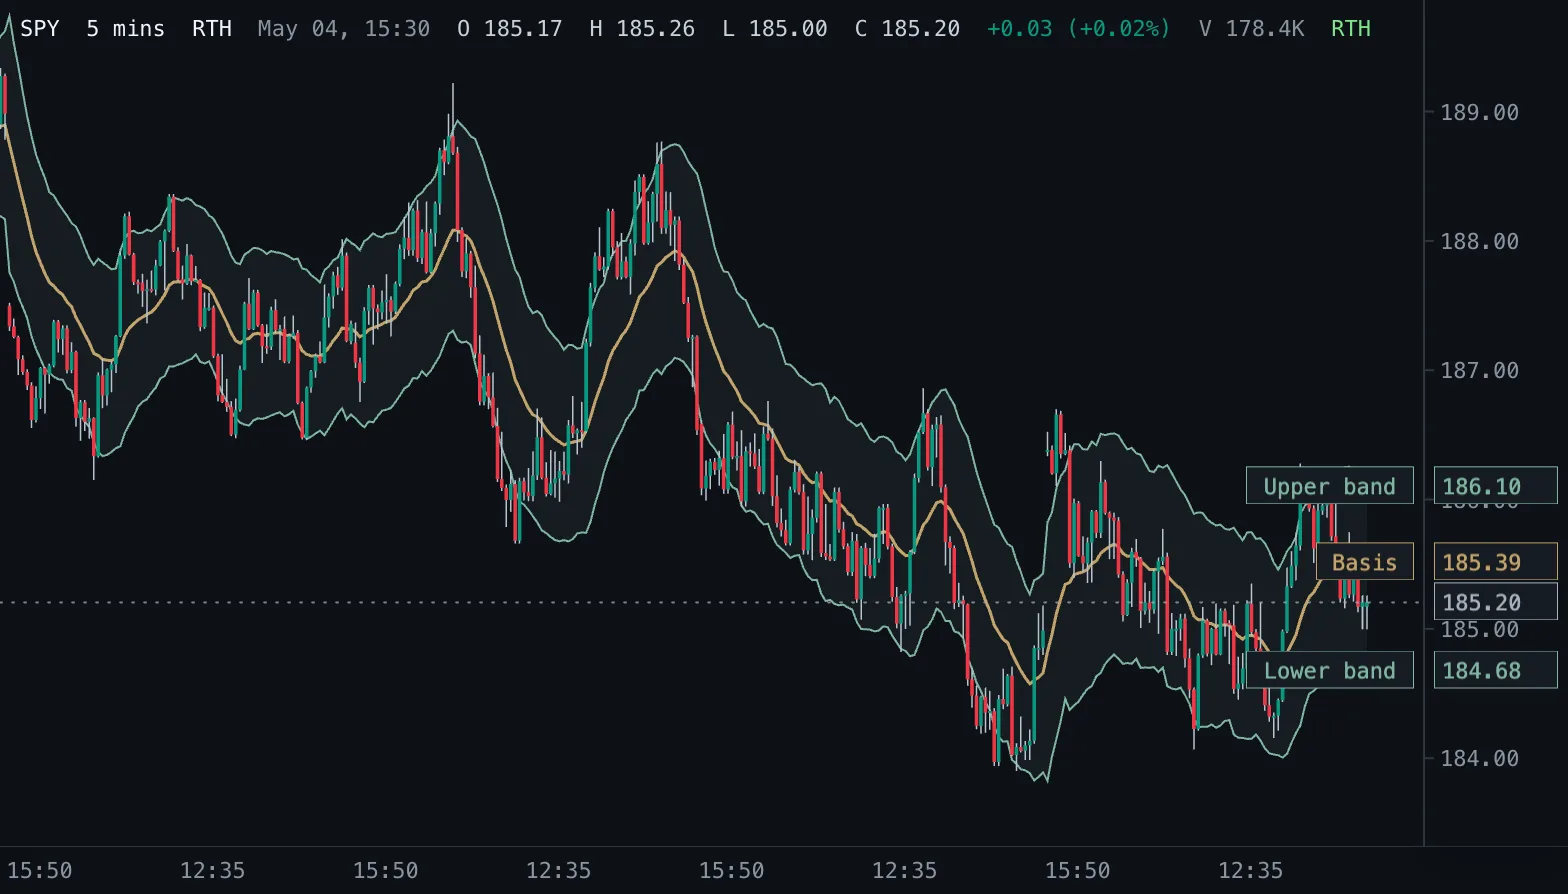
Keltner Channels KC
An exponential moving average with bands a multiple of the Average True Range above and below it.
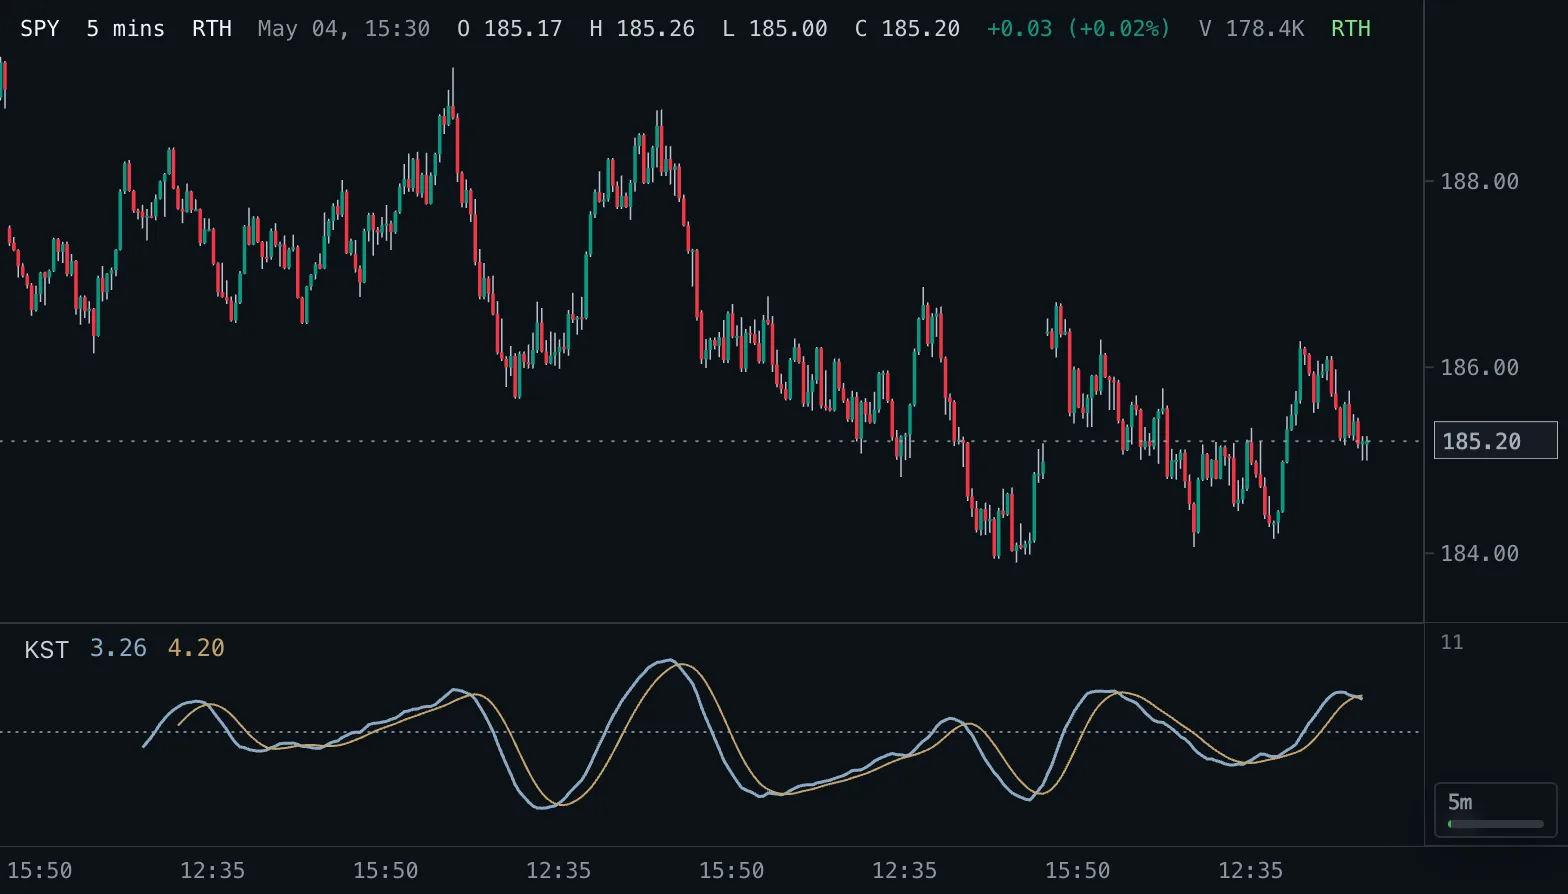
Know Sure Thing KST
A weighted sum of four smoothed rates of change over rising lookbacks, with a signal line and a zero line.
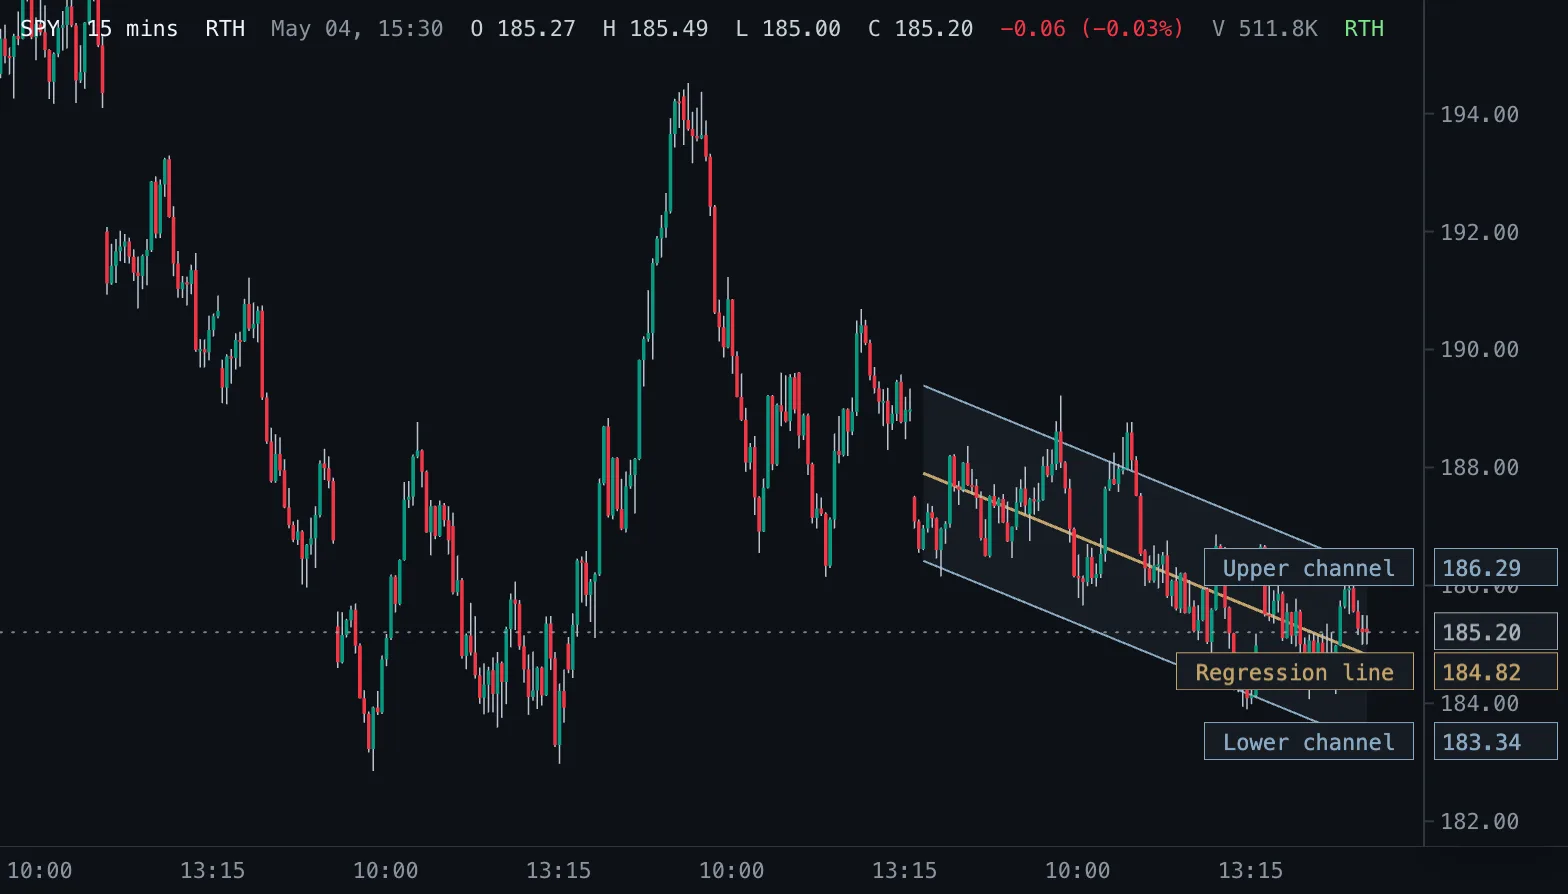
Linear Regression Channel LRC
The best-fit straight line through the last bars, with a channel a chosen number of standard deviations around it.
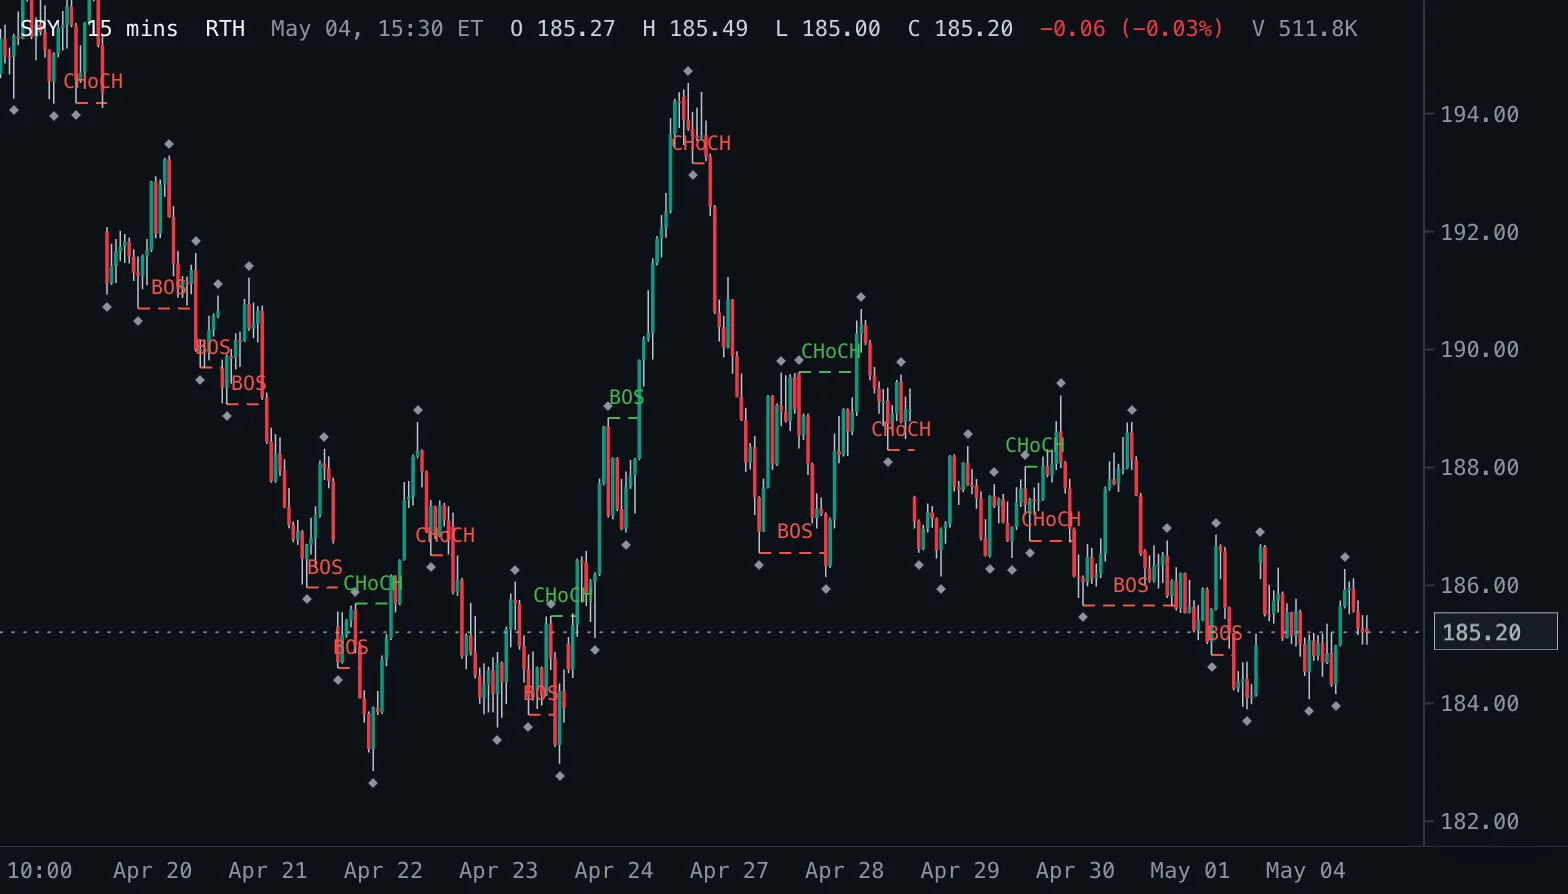
Market Structure BOS/CHoCH Structure
Swing highs and lows from fractal pivots, and a line with a BOS or CHoCH label wherever a close breaks the last swing: with the trend a break of structure, against it a change of character.
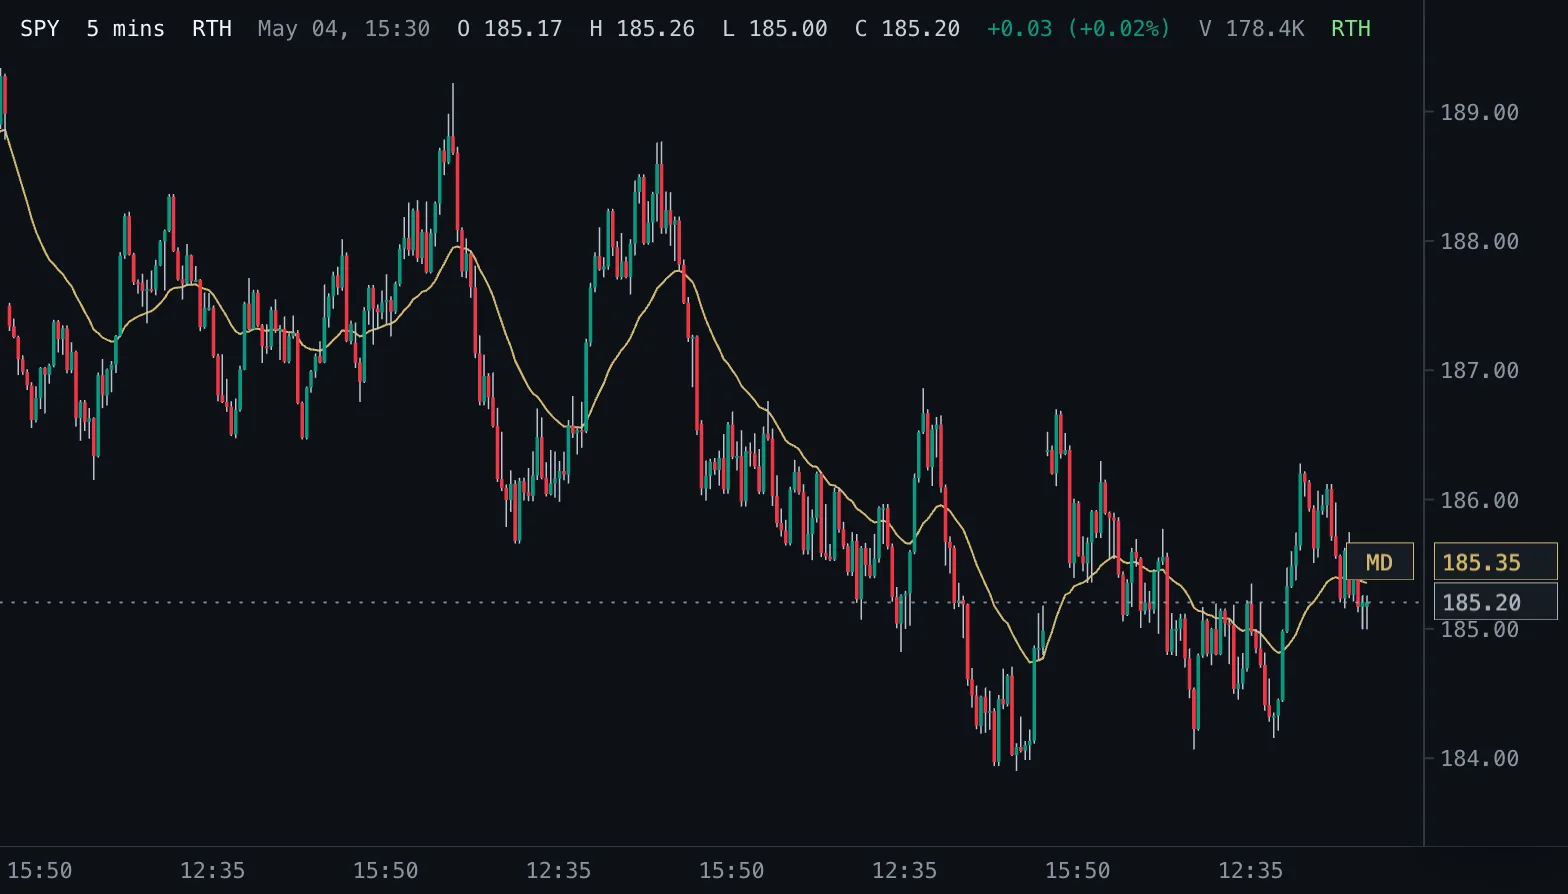
McGinley Dynamic MD
John McGinley's self-adjusting moving average that speeds up when price falls away from it and avoids whipsaws, drawn on the candles.
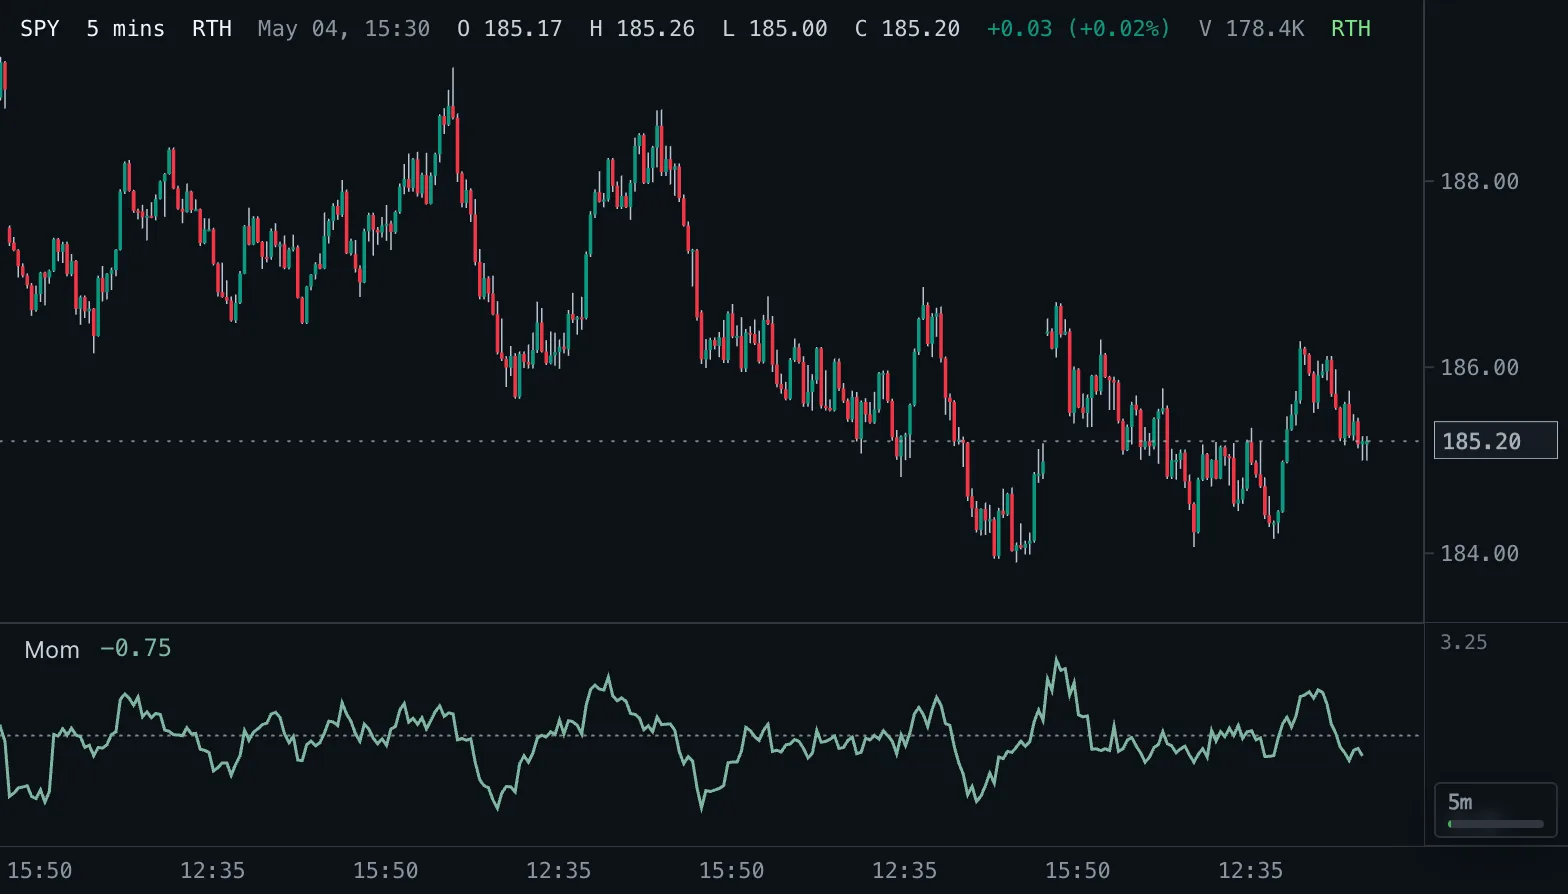
Momentum Mom
Price change over the last Length bars in price units, around a zero line.
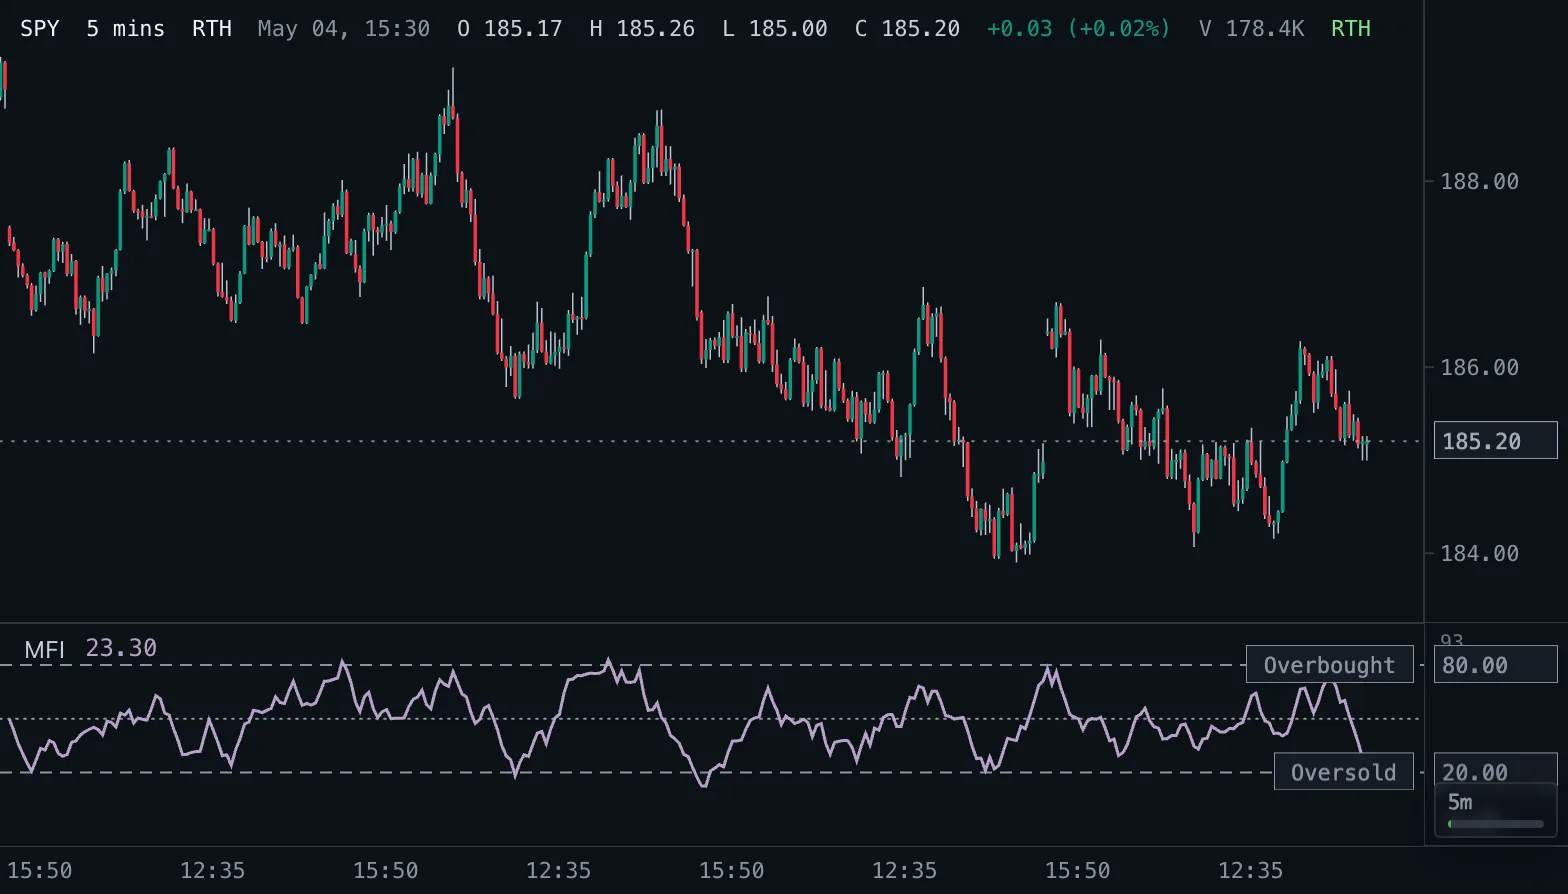
Money Flow Index MFI
Volume-weighted momentum oscillator from 0 to 100 that compares money flowing into rising and falling bars.
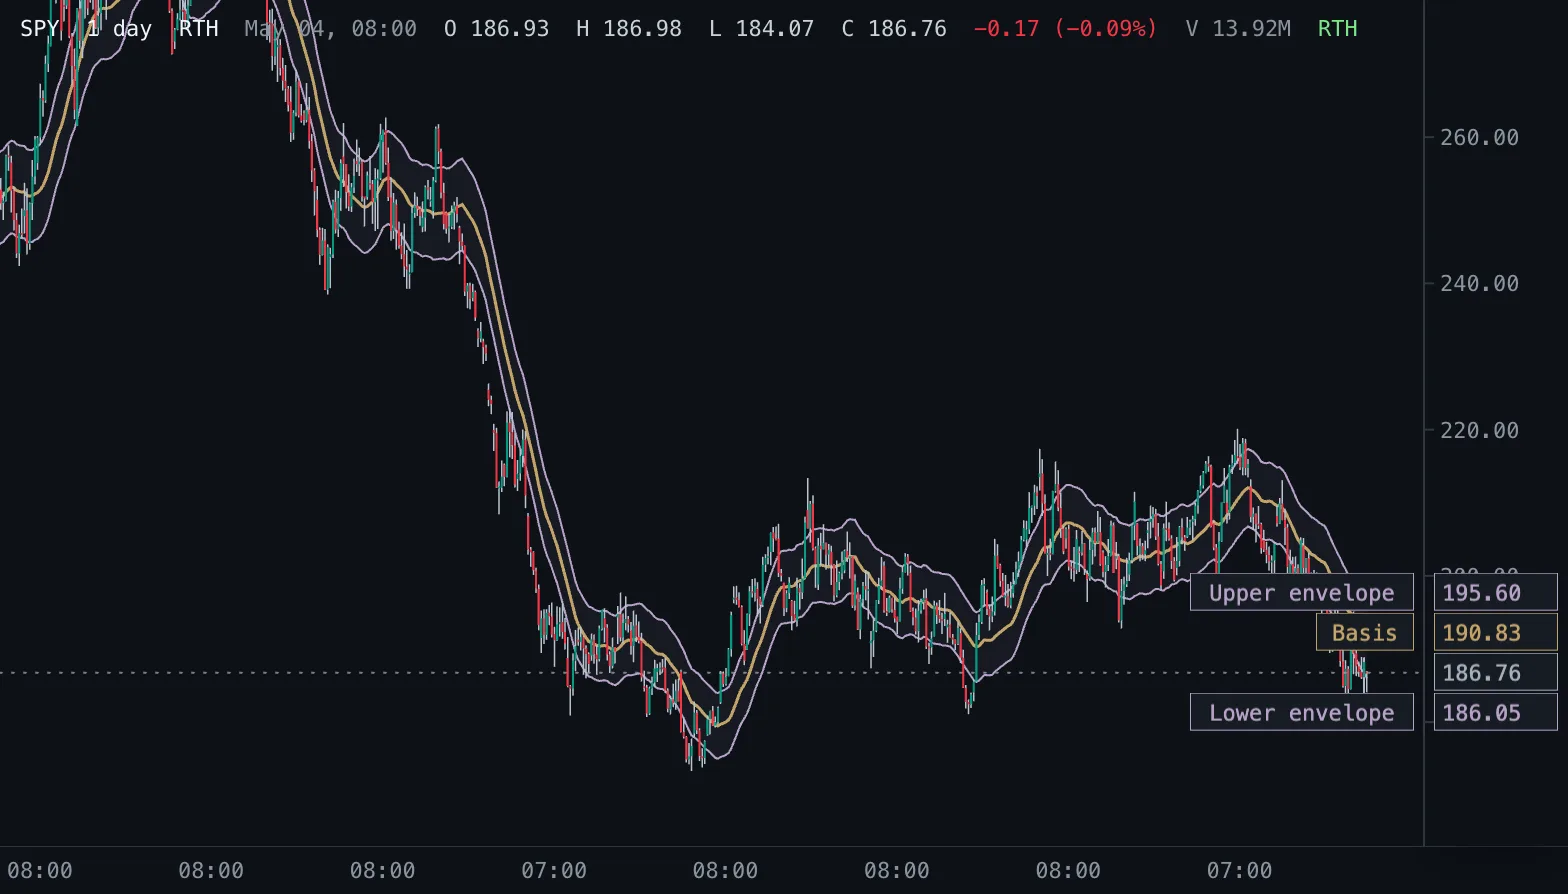
Moving Average Envelopes ENV
A moving average with bands a fixed percentage above and below it.
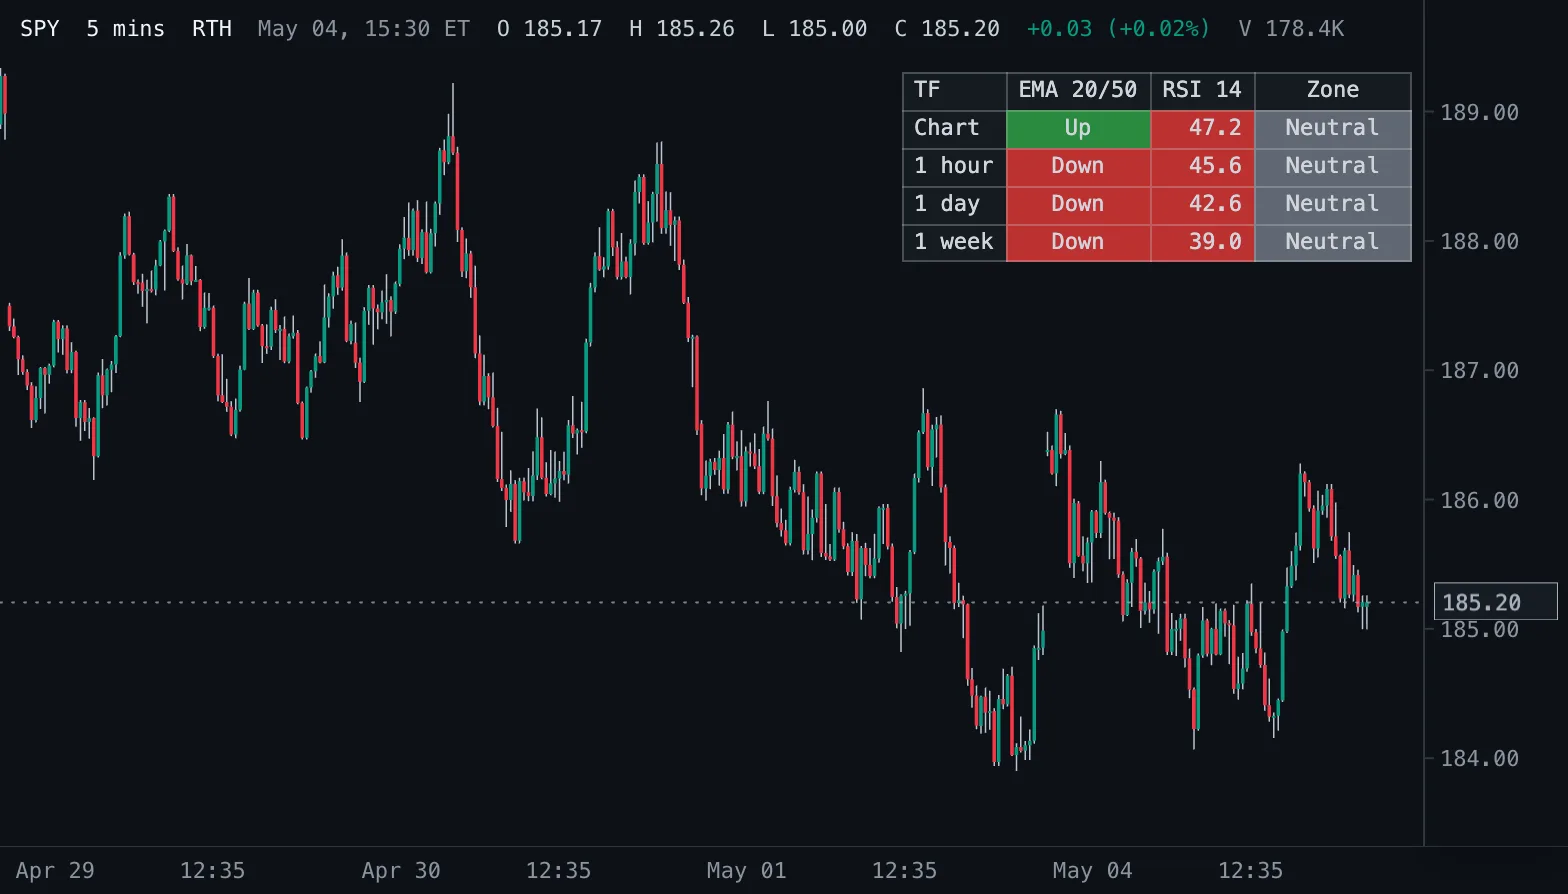
Multi-Timeframe Trend Dashboard MTF Trend
A table with the EMA 20/50 trend and the RSI 14 of the chart's bars and of hourly, daily and weekly bars, each cell coloured by its state.
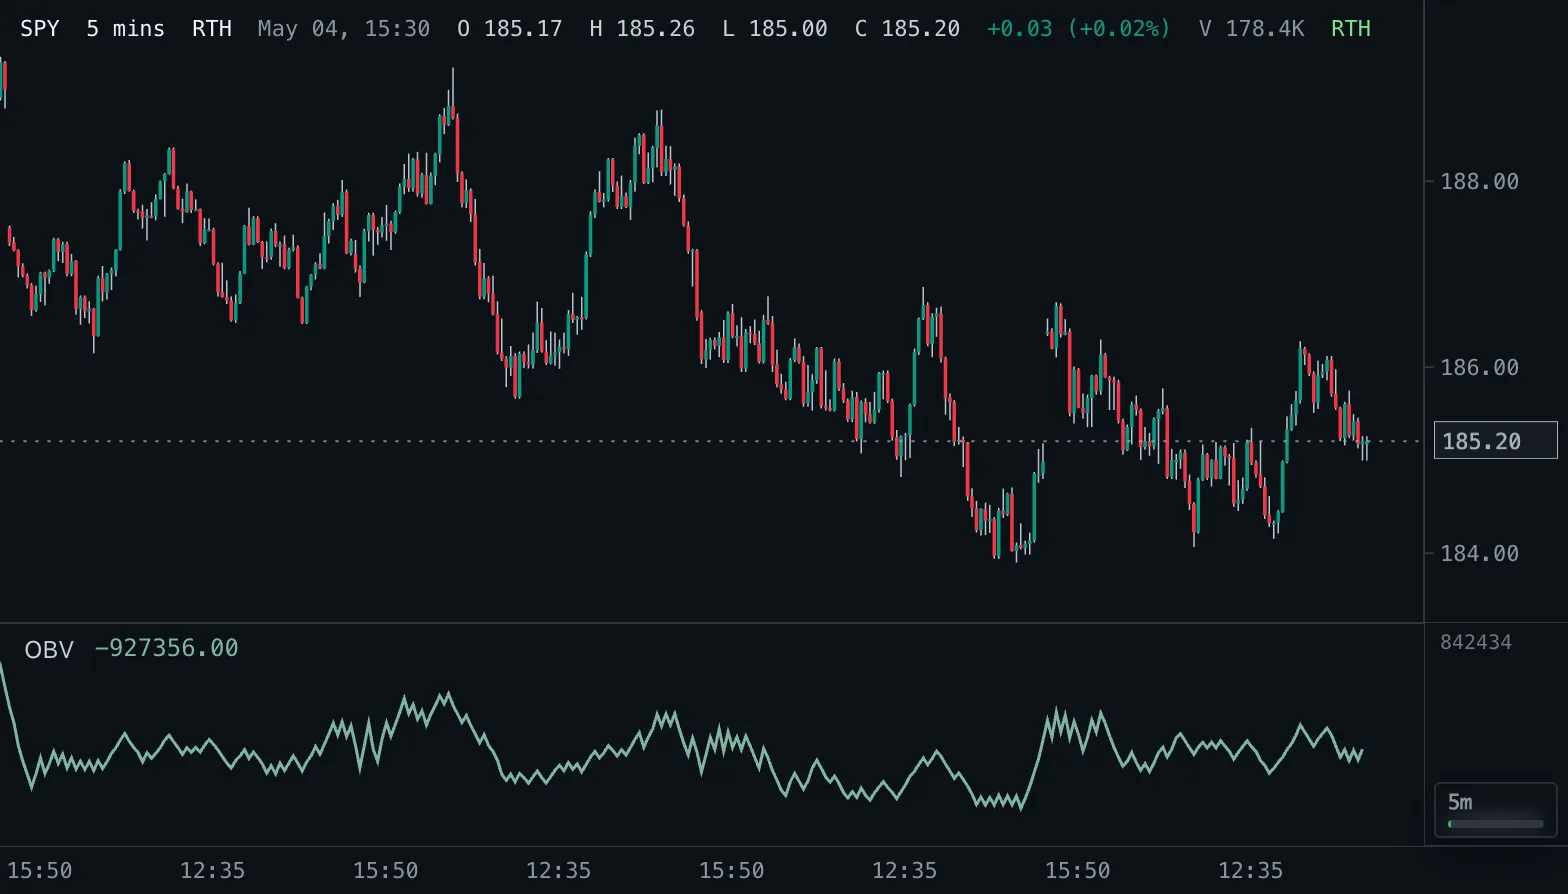
On Balance Volume OBV
Running total of volume that adds the volume of up closes and subtracts the volume of down closes, with an optional signal line.
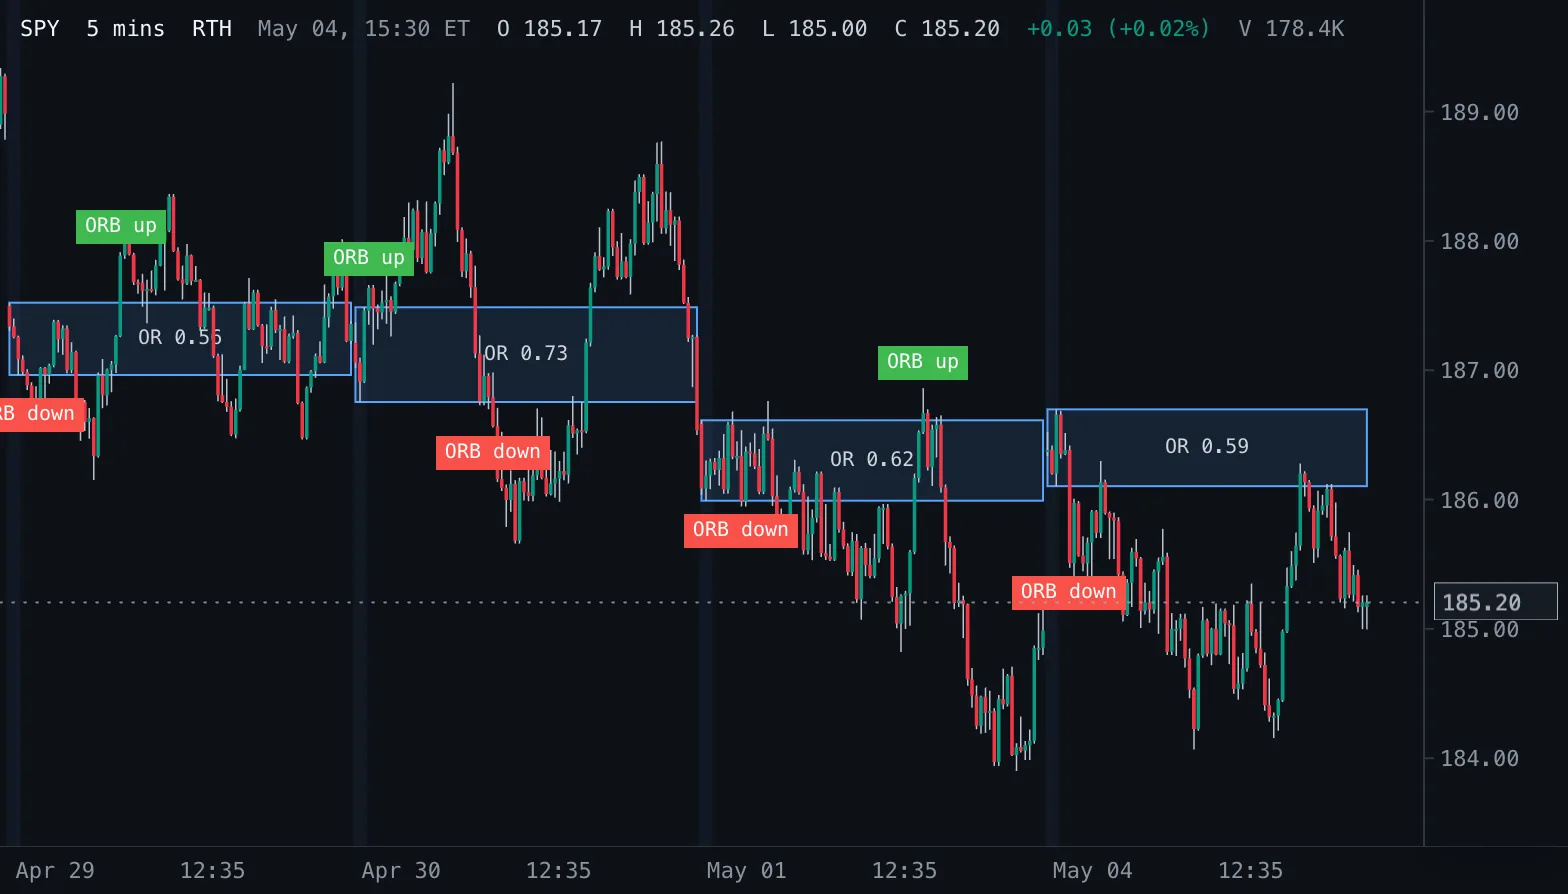
Opening Range Box OR Box
Boxes the high and low of the first minutes of every New York regular session, shades those bars, and labels the first close above or below the range.
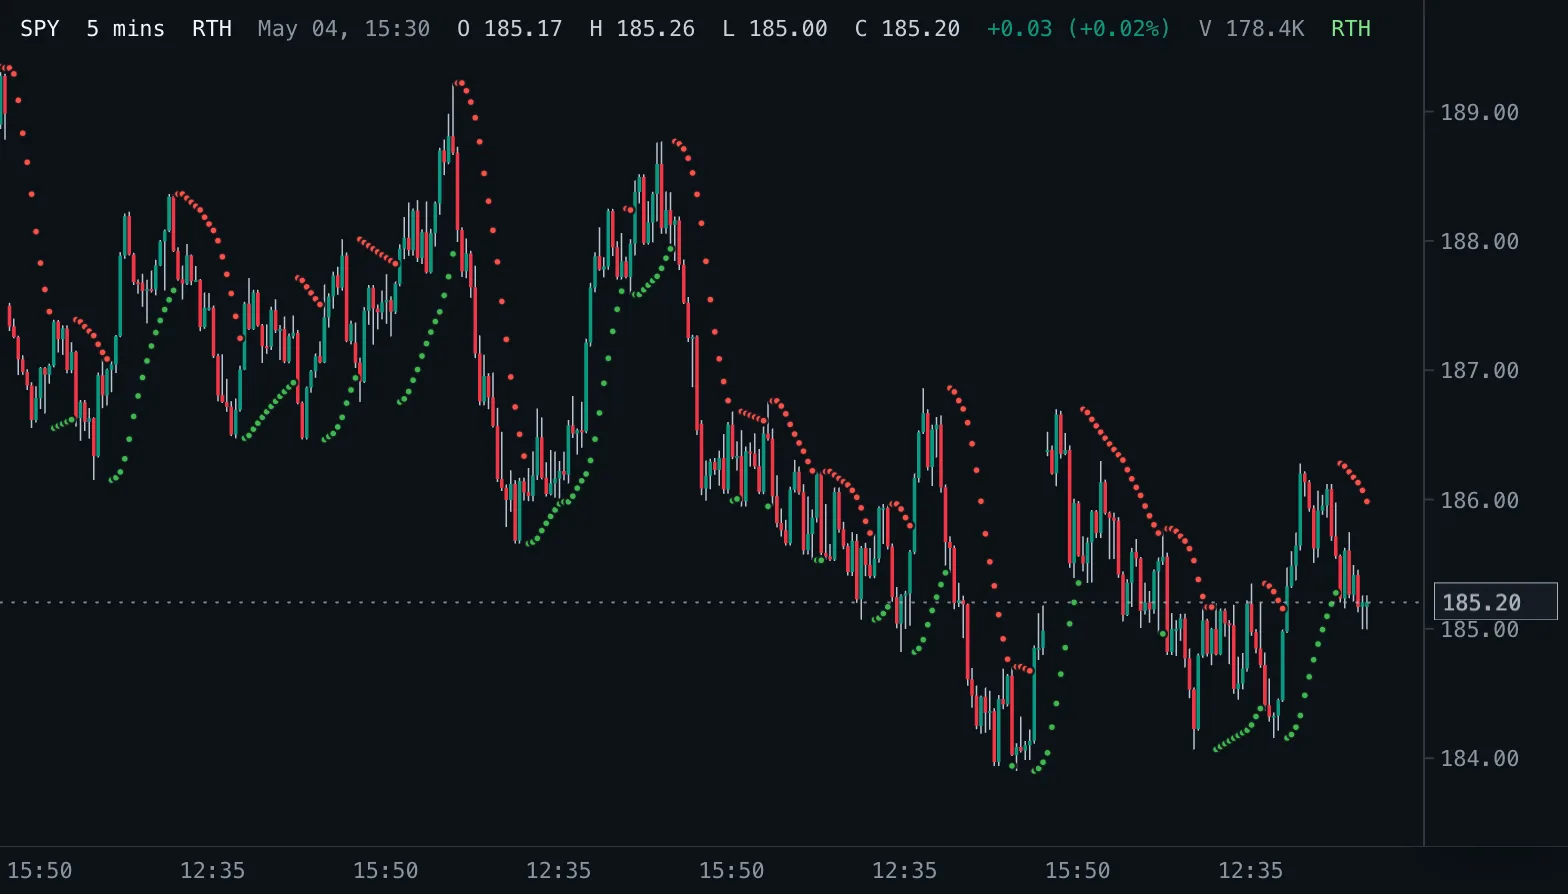
Parabolic SAR SAR
Wilder's stop and reverse: one dot per bar that trails price and speeds up as the trend makes new extremes.
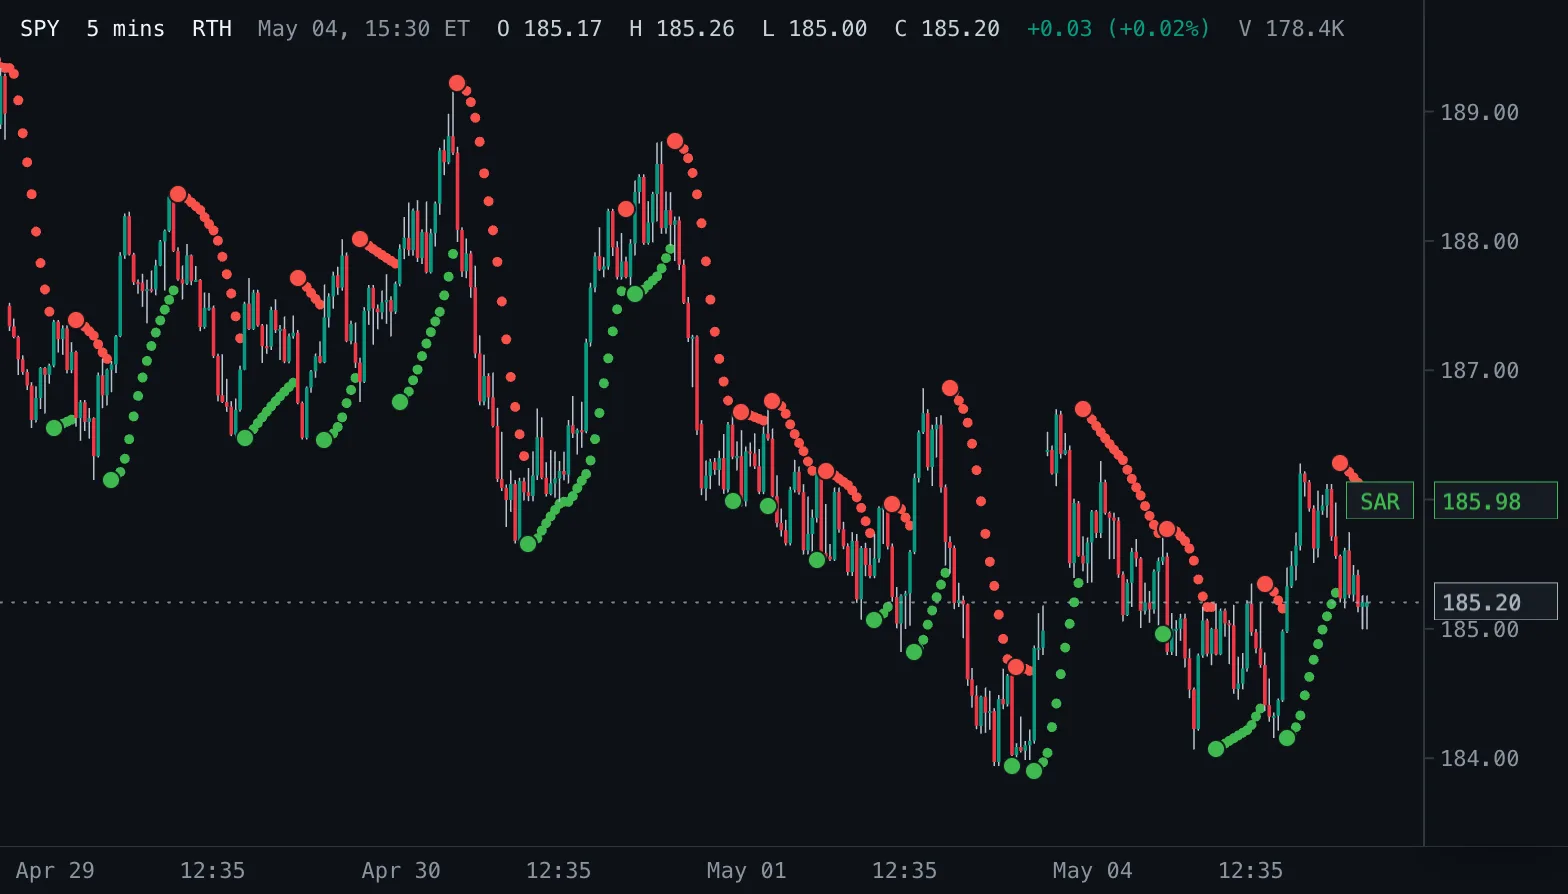
Parabolic SAR Dots SAR Dots
Wilder's Parabolic SAR drawn as circles coloured by the side of the trend, with a larger dot on every stop-and-reverse bar.
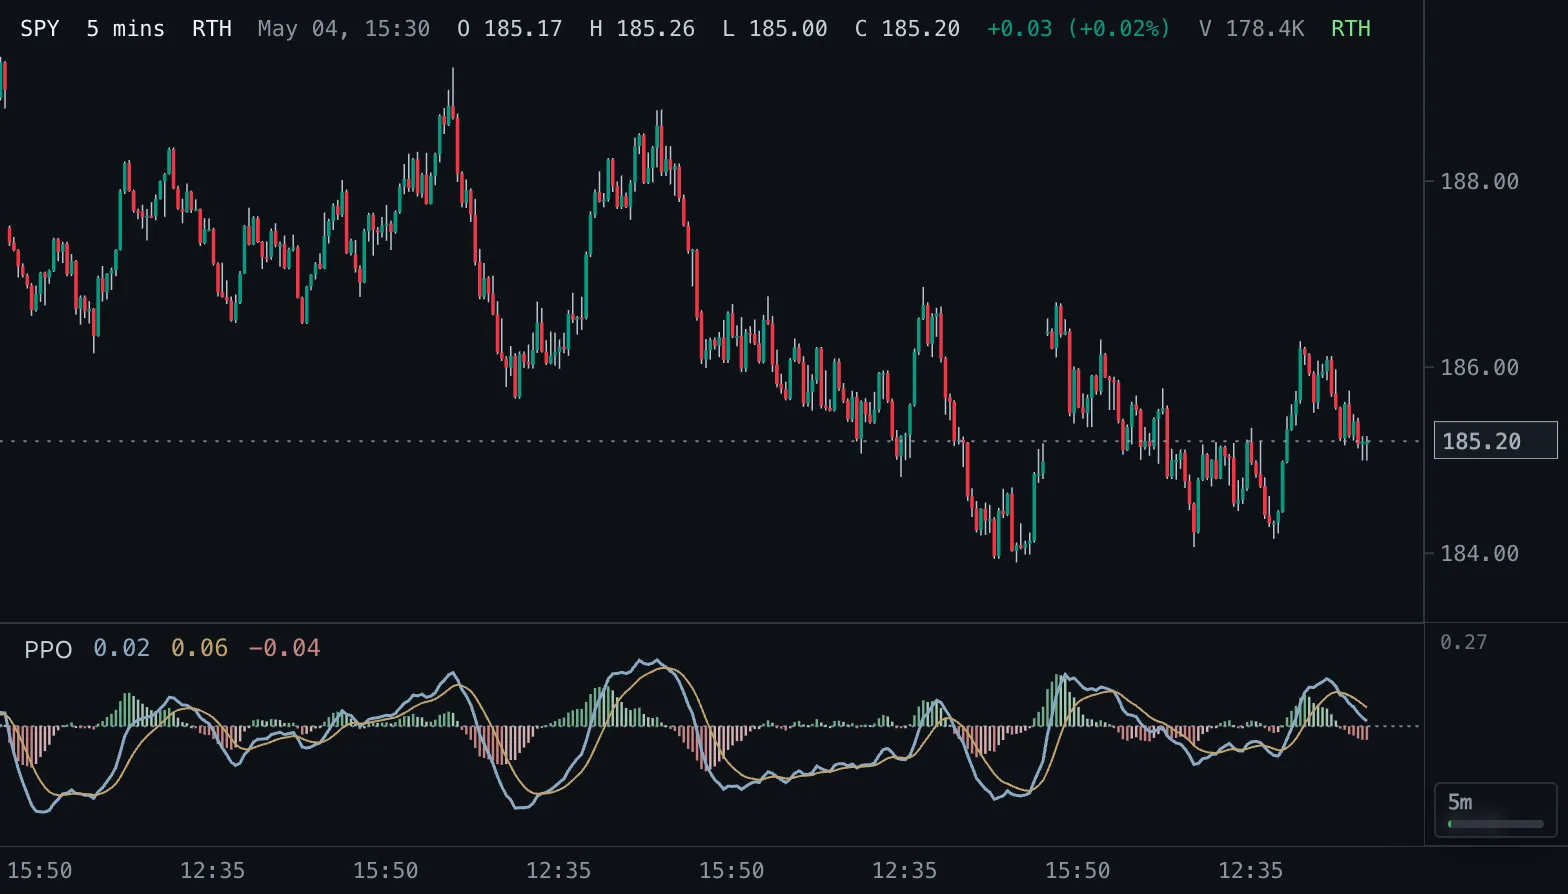
Percentage Price Oscillator PPO
MACD in percent of the slow average: PPO line, signal line and a four-color histogram.
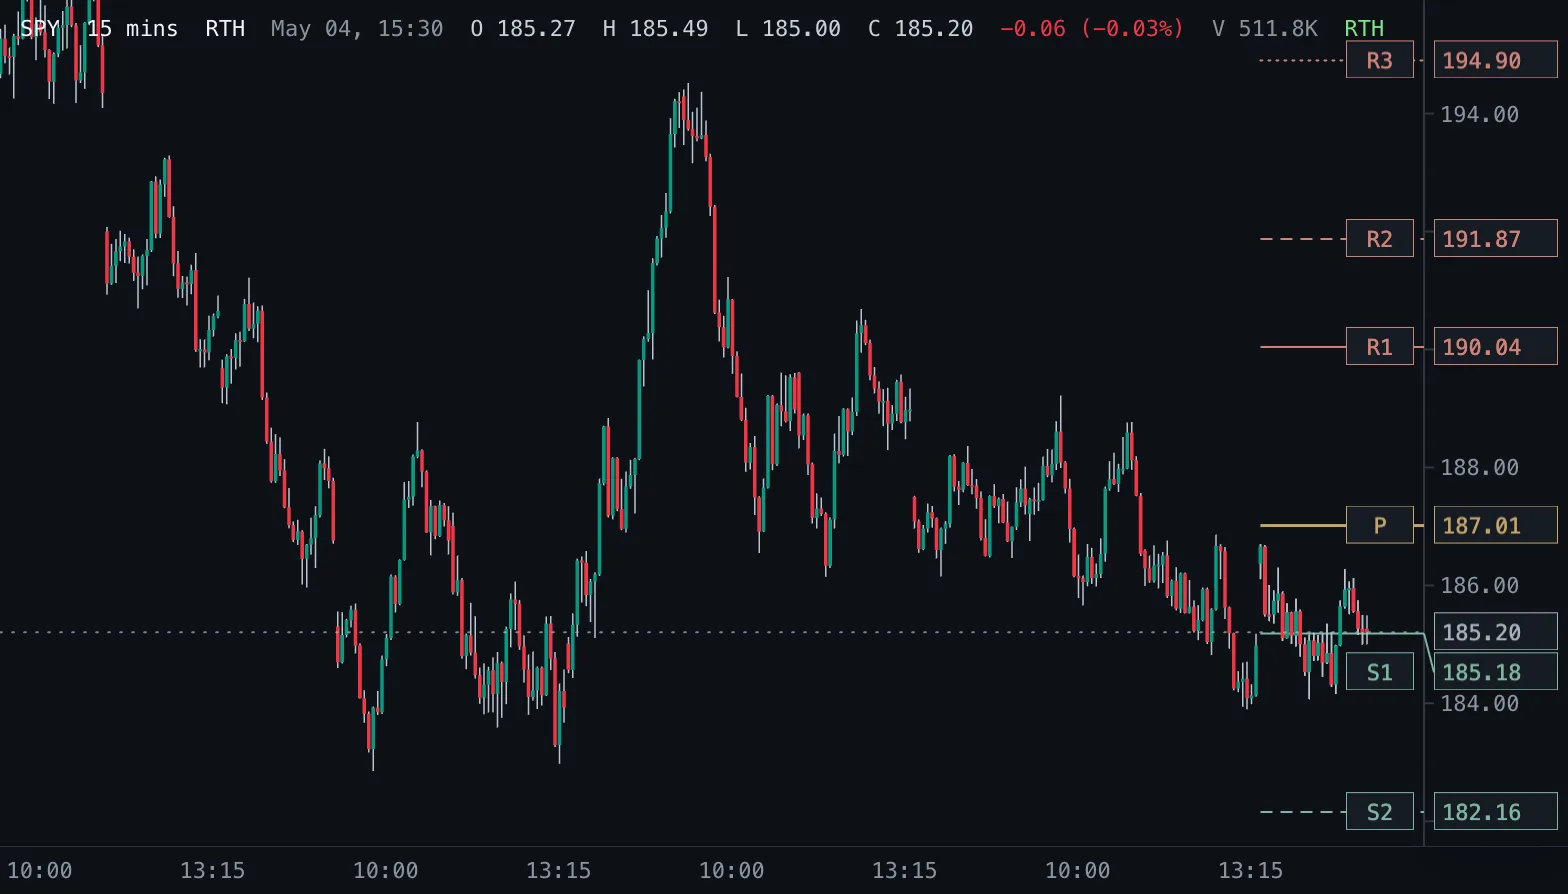
Pivot Points Pivots
Traditional, Fibonacci, Camarilla or Woodie pivot point, resistance and support levels from the previous day, week, month or year.
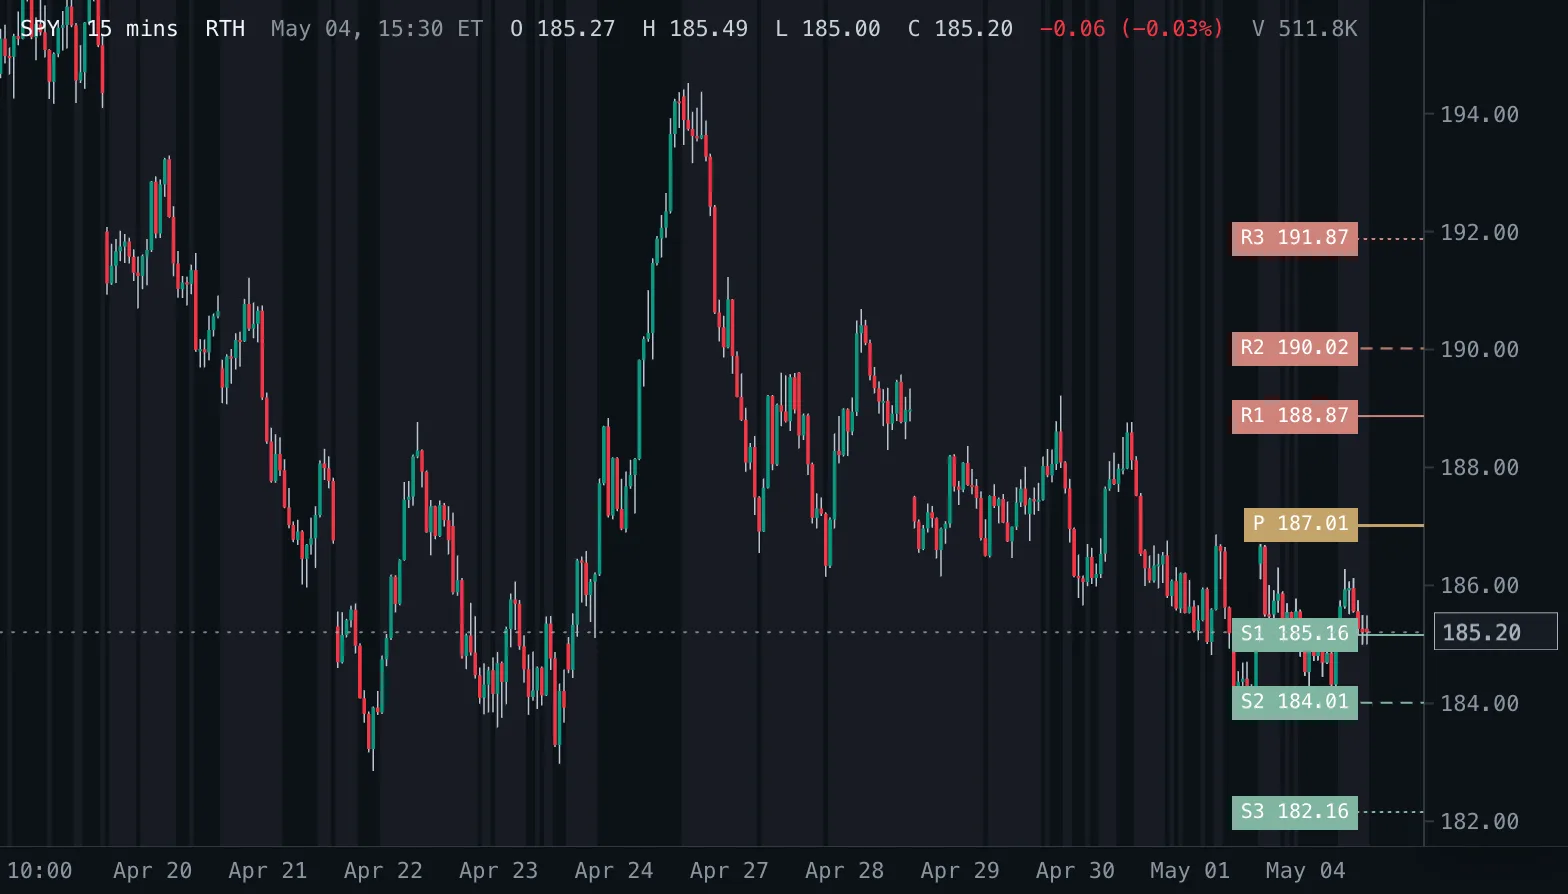
Pivot Points Fibonacci & Camarilla Fib/Cam
Daily Fibonacci or Camarilla pivot levels from the previous regular session, named with their prices at the right edge, with the bars that close between S1 and R1 shaded.
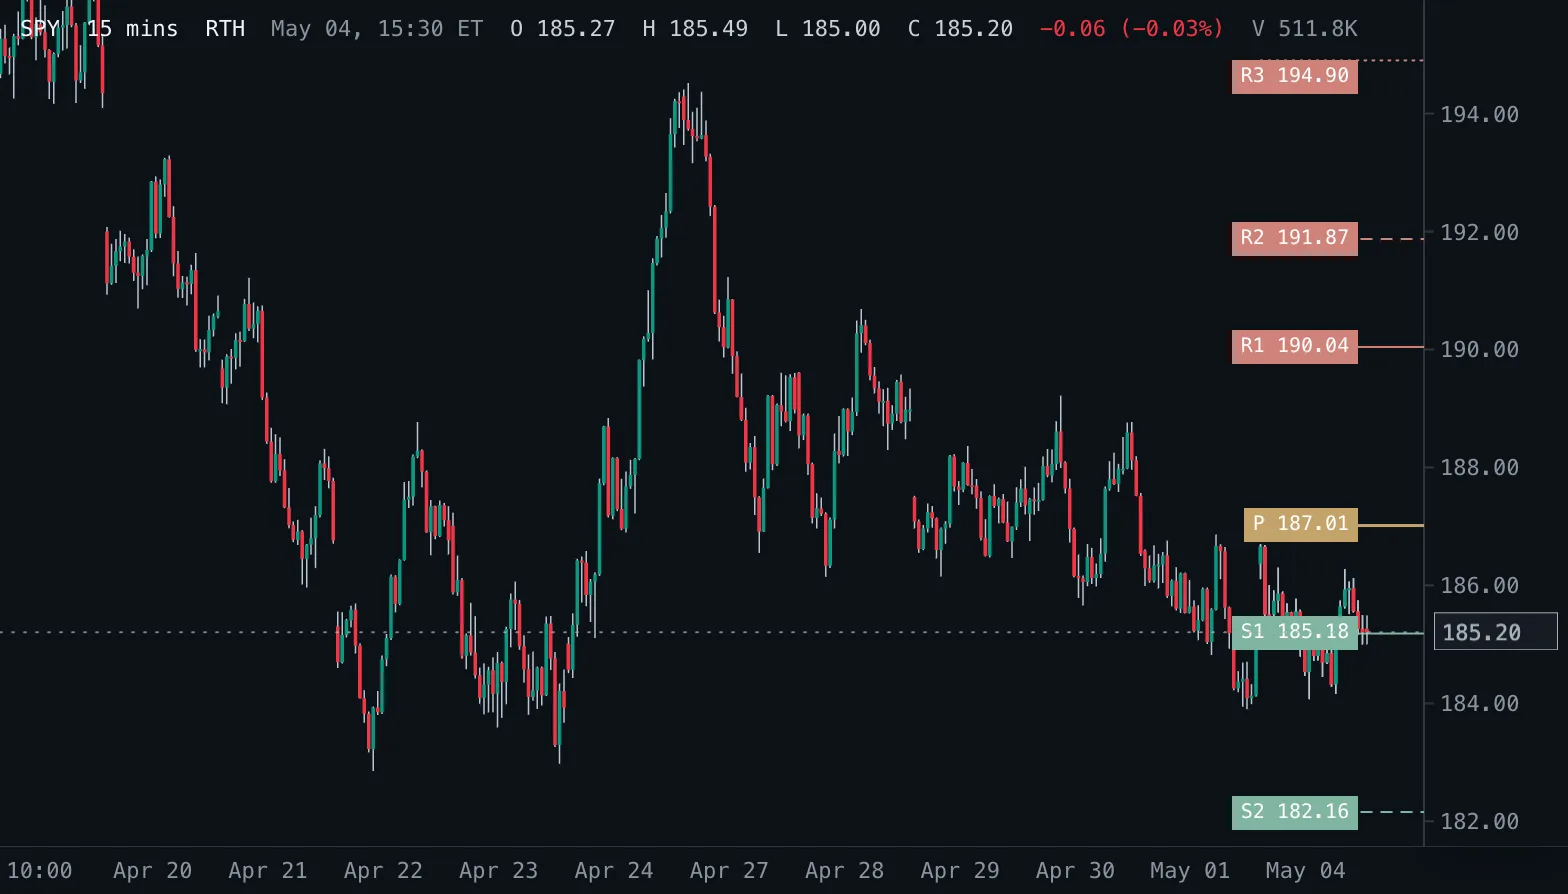
Pivot Points Standard (Labeled) Pivots
Standard (floor trader) daily pivot point with three resistance and three support levels from the previous regular session, each named with its price at the right edge.
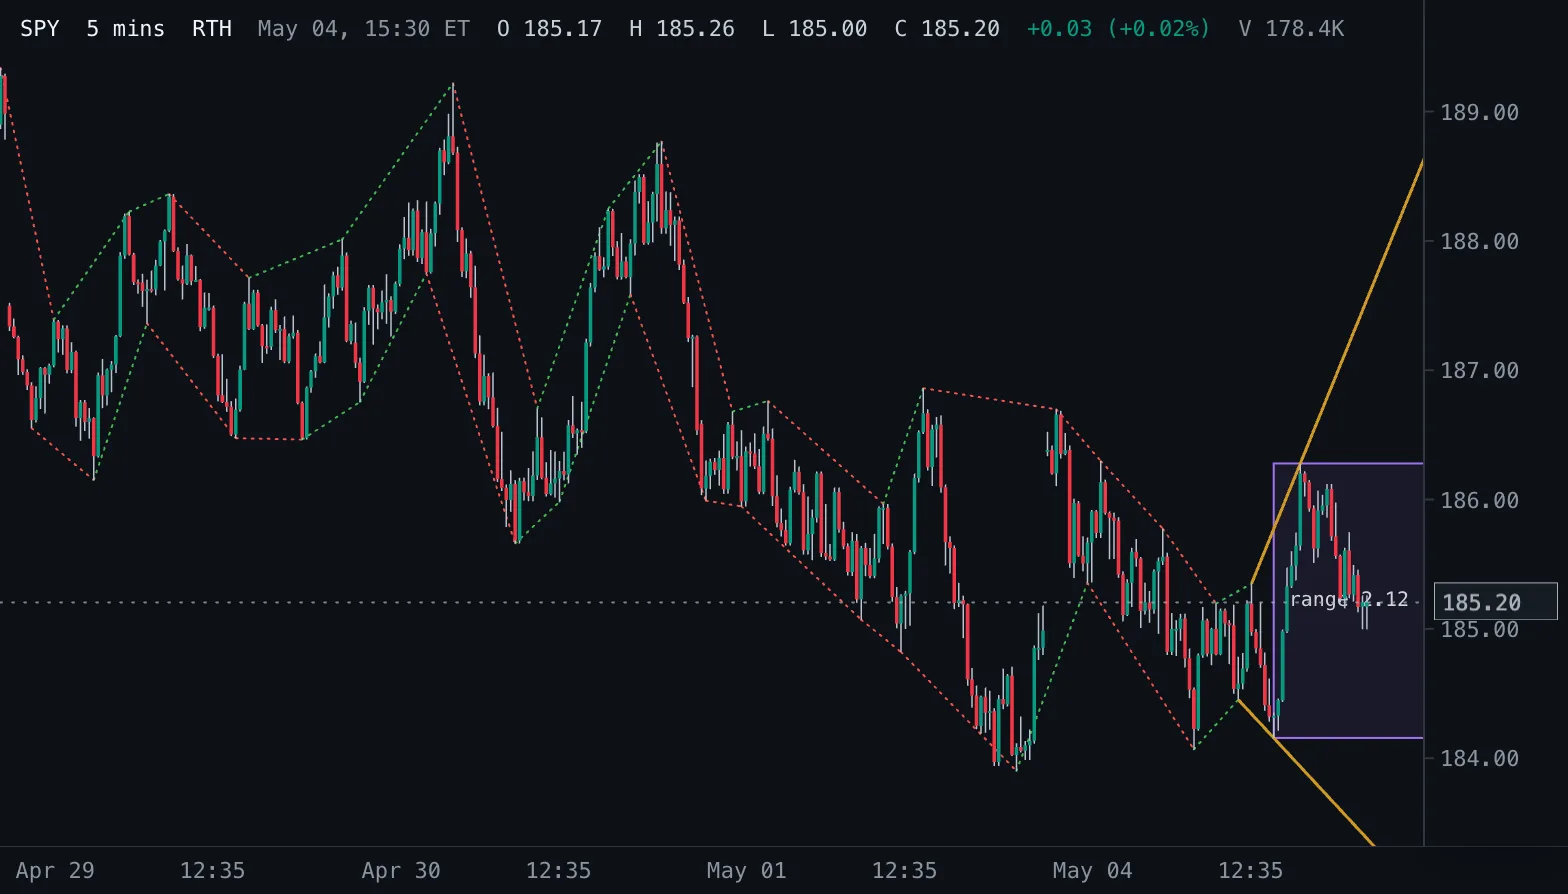
Pivot Trendlines Trendlines
Connects consecutive confirmed swing highs and swing lows, extends the latest high and low line to the right, and boxes the range between the latest swing high and low.
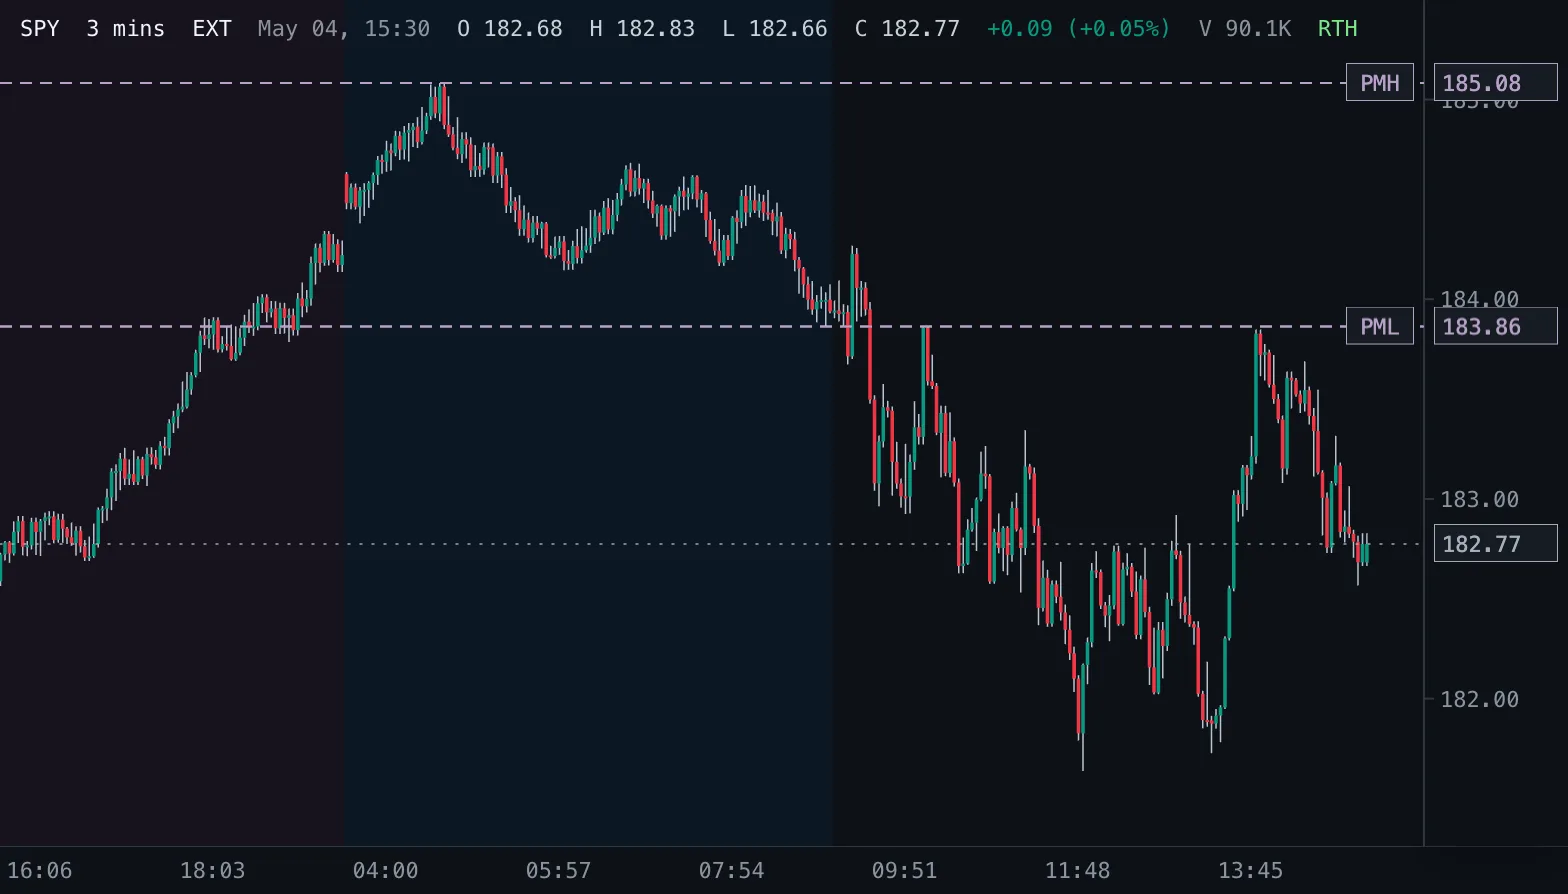
Premarket High/Low PMx
Premarket high and low from 04:10 to 09:30 New York time, plus the opening-volatility extremes before 04:10.
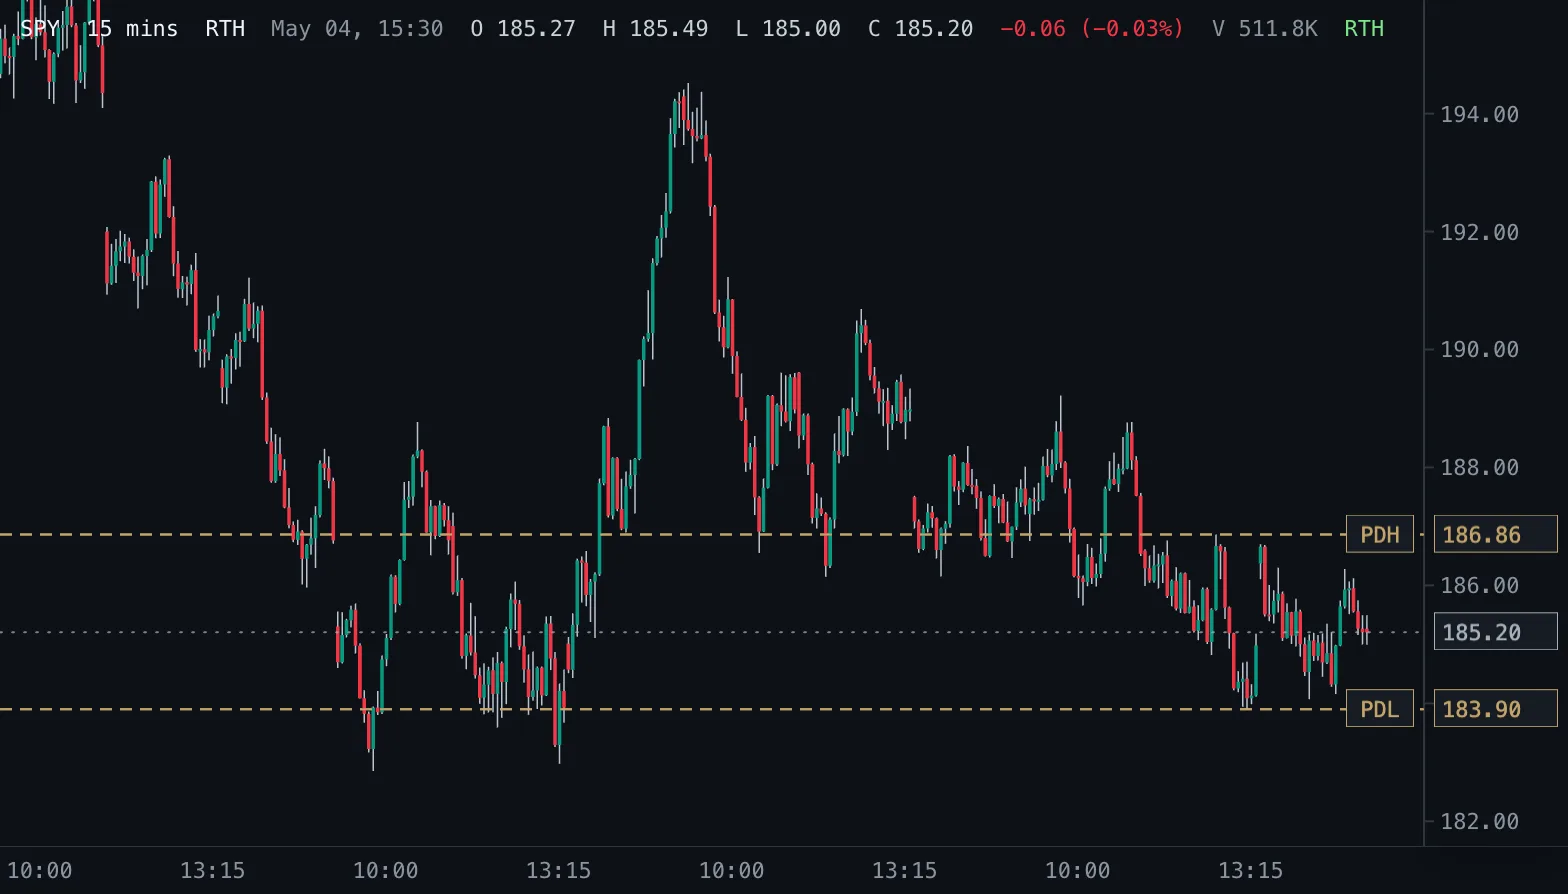
Previous Day High/Low PDx
High and low of the previous regular trading session as horizontal levels on intraday and daily charts, with optional history.
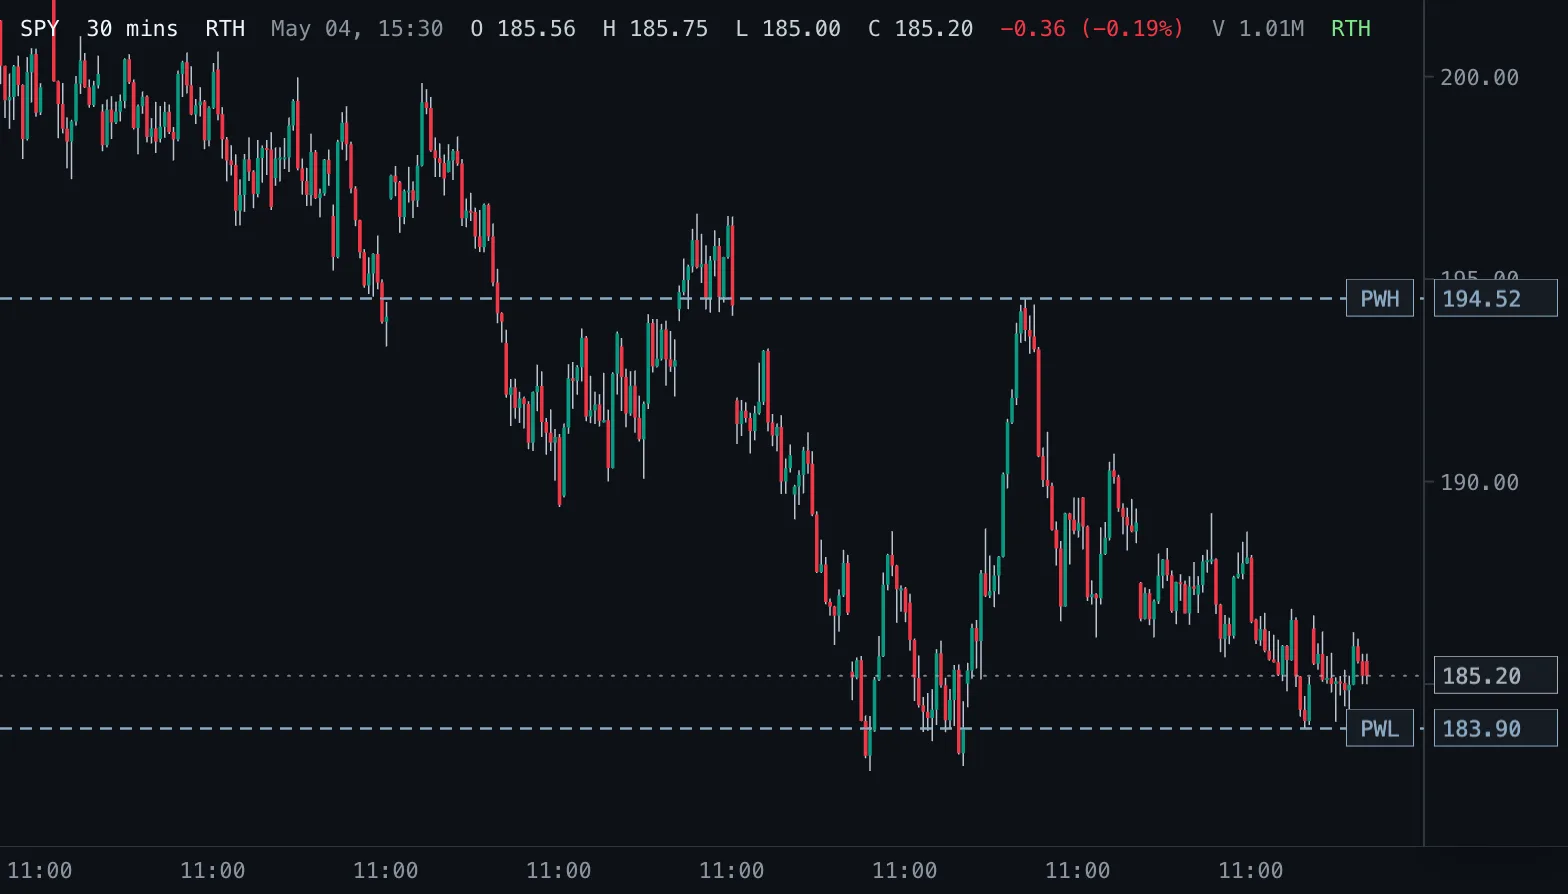
Previous Week High/Low PWx
High and low of the previous trading week as horizontal levels, with optional history.
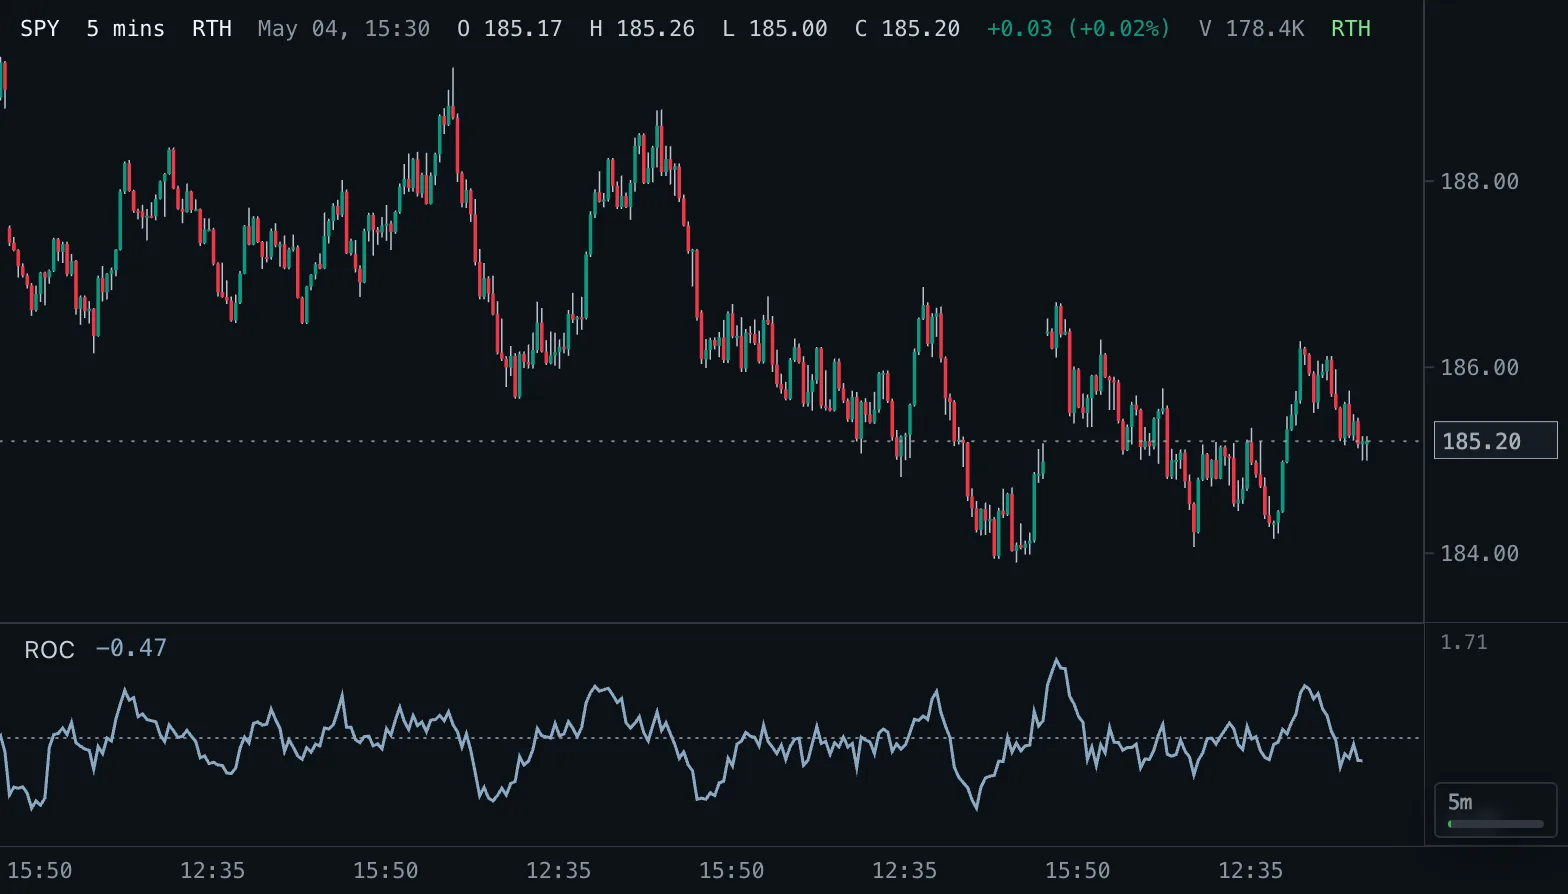
Rate of Change ROC
Percent change of price over the last Length bars, around a zero line.
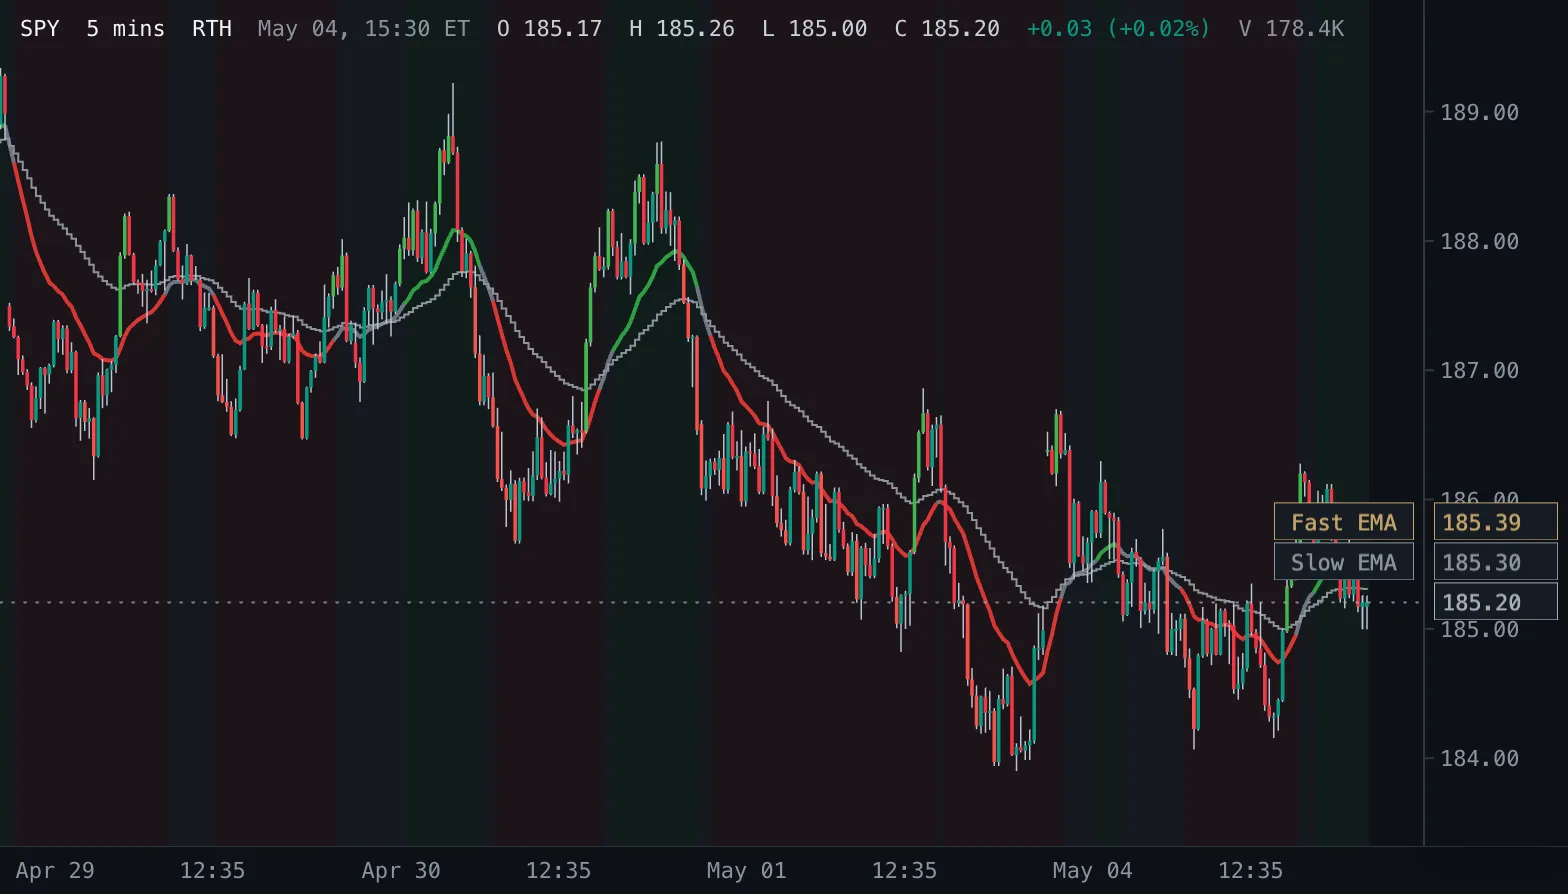
Regime Shading Regime
Shades the price pane by EMA trend regime, colours the fast EMA by regime and recolours the candles that close beyond the recent closing range.
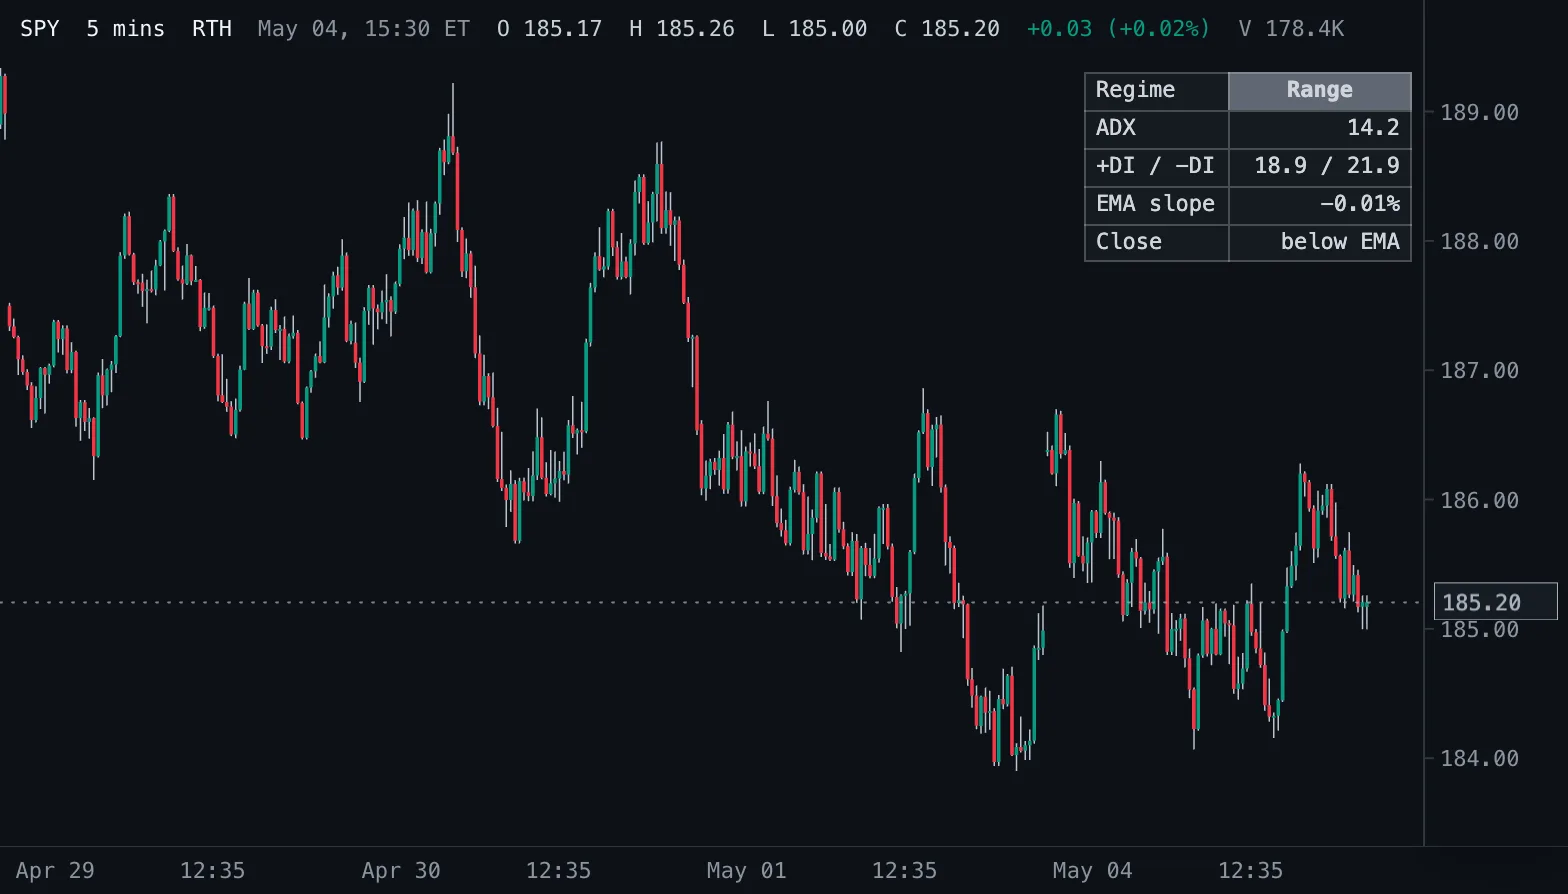
Regime Table Regime
A table on the price pane that classifies the latest bar as trending up, trending down or ranging from ADX, the directional indicators and the slope of an EMA.
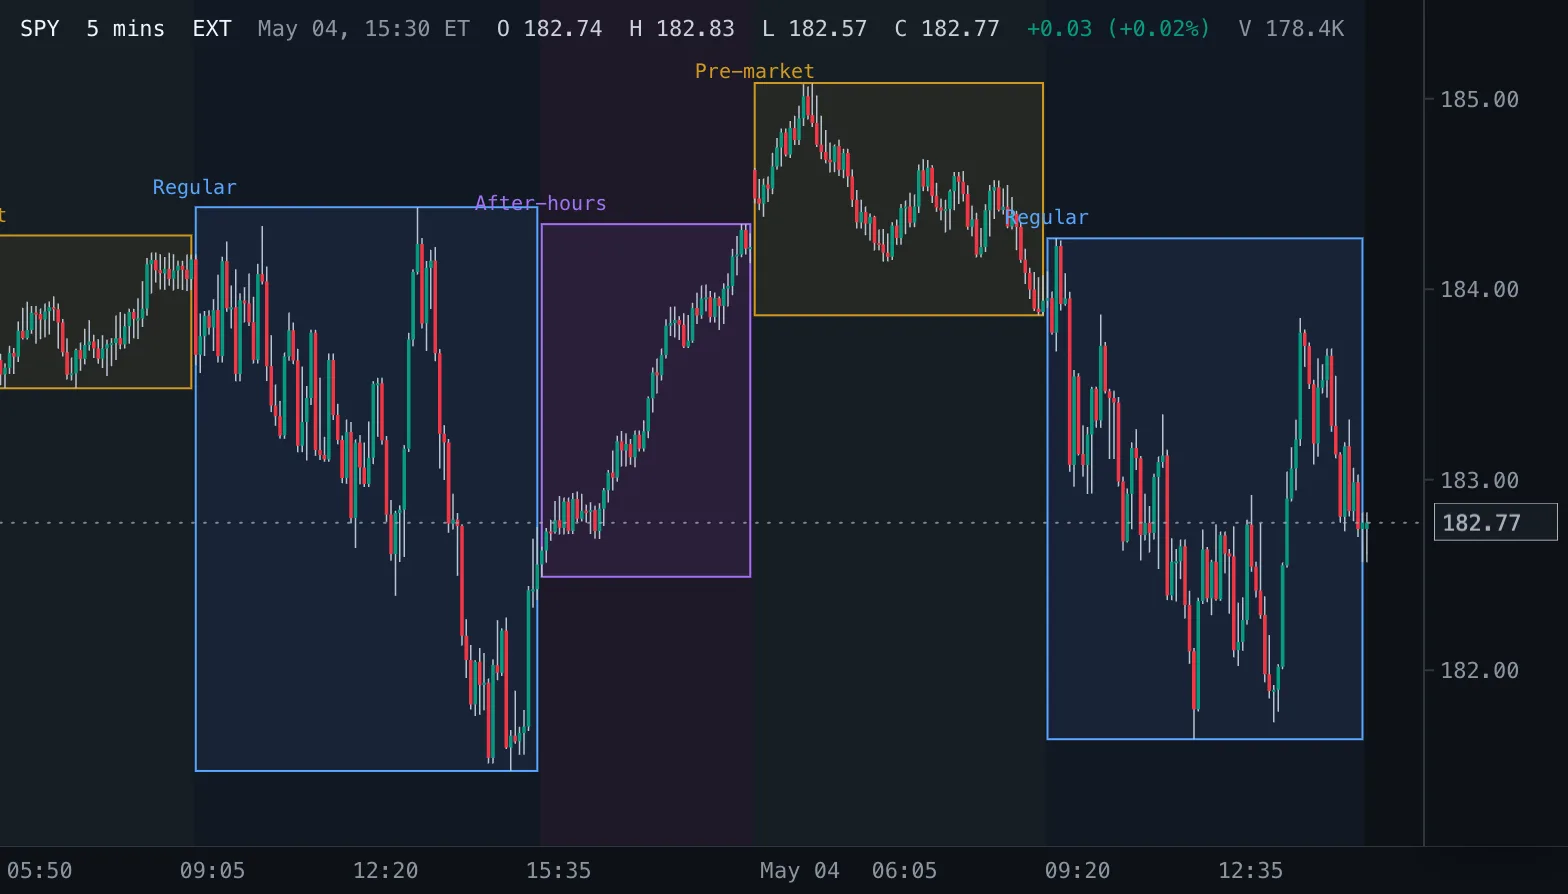
Session High/Low Boxes Sessions
A box over the high and low of every New York pre-market, regular and after-hours session, the session's bars shaded in its colour and its name above the box.
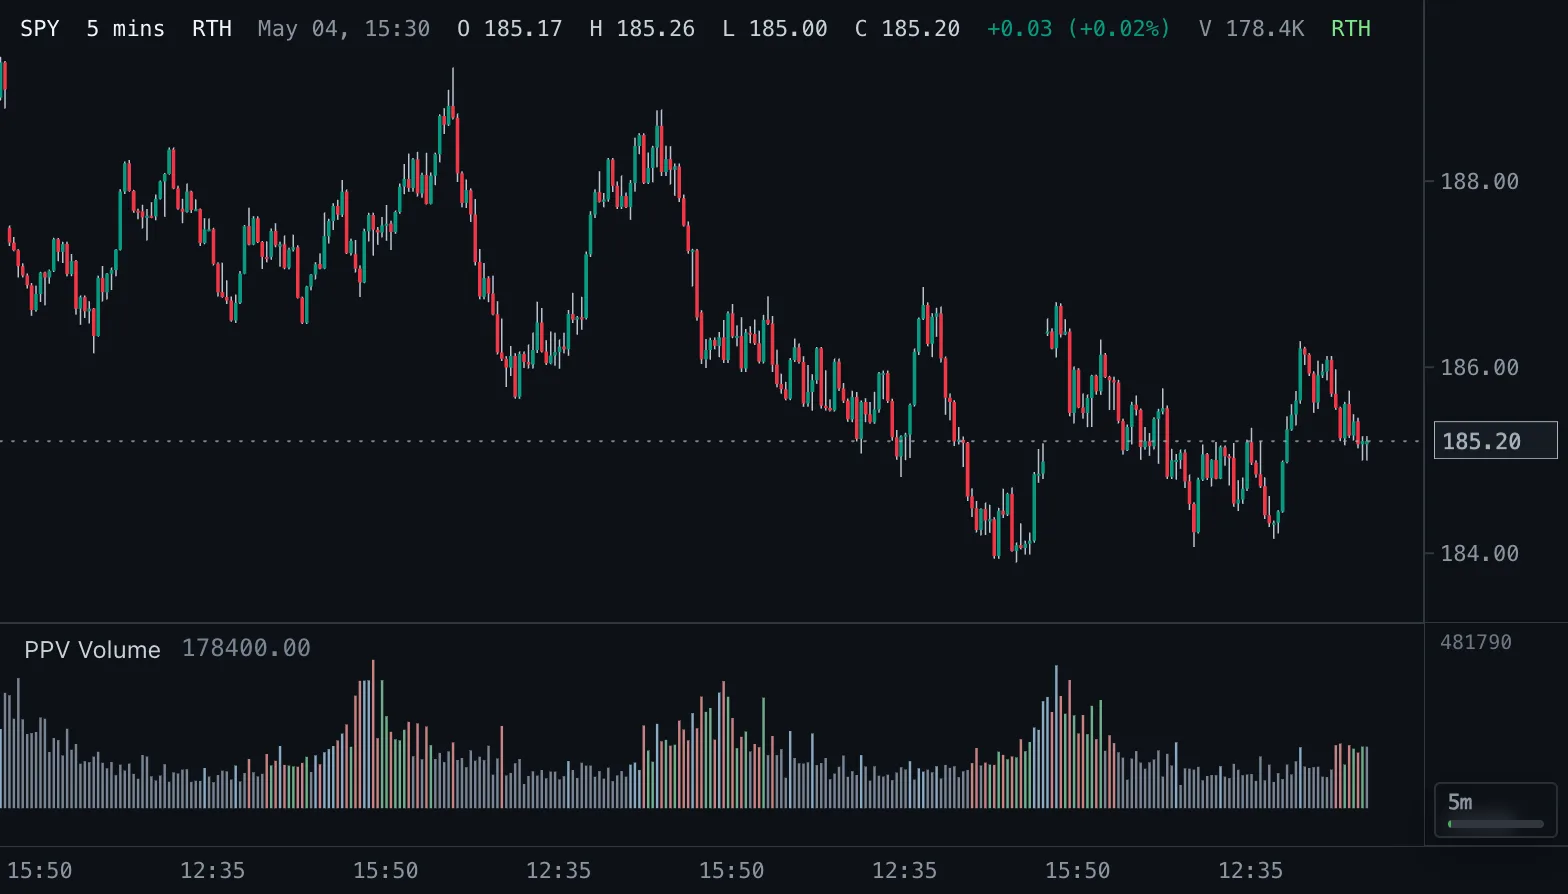
Simple Volume + Pocket Pivots PPV Volume
Volume histogram colored by class: pocket pivots, above-average up bars, above-average down bars and neutral bars.
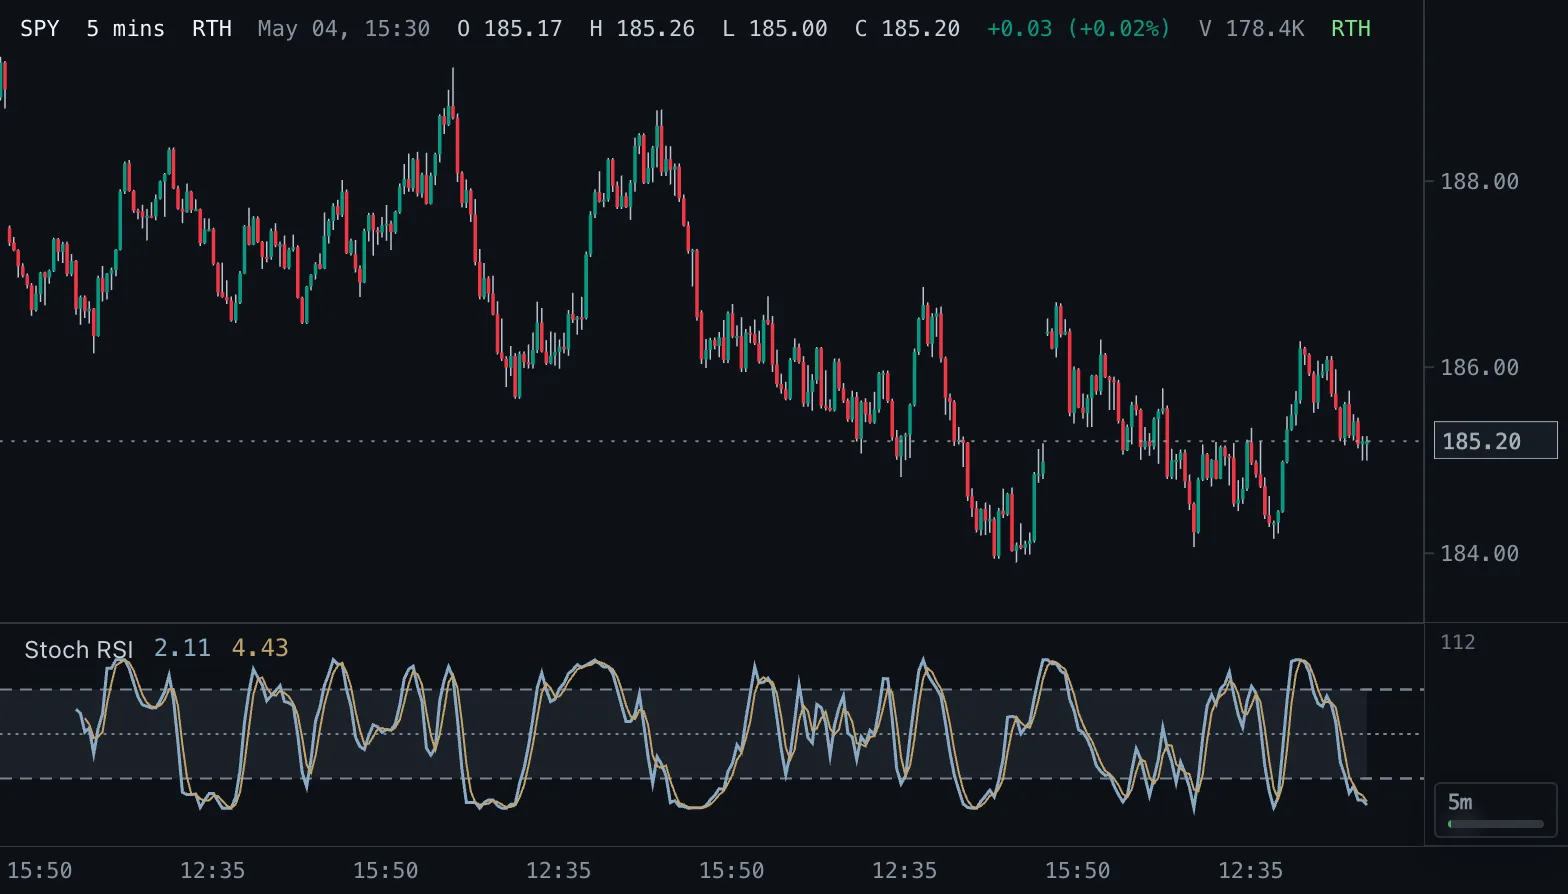
Stochastic RSI Stoch RSI
The Stochastic formula applied to RSI: where RSI sits inside its own recent range, with %K, %D and 80/20 bands.
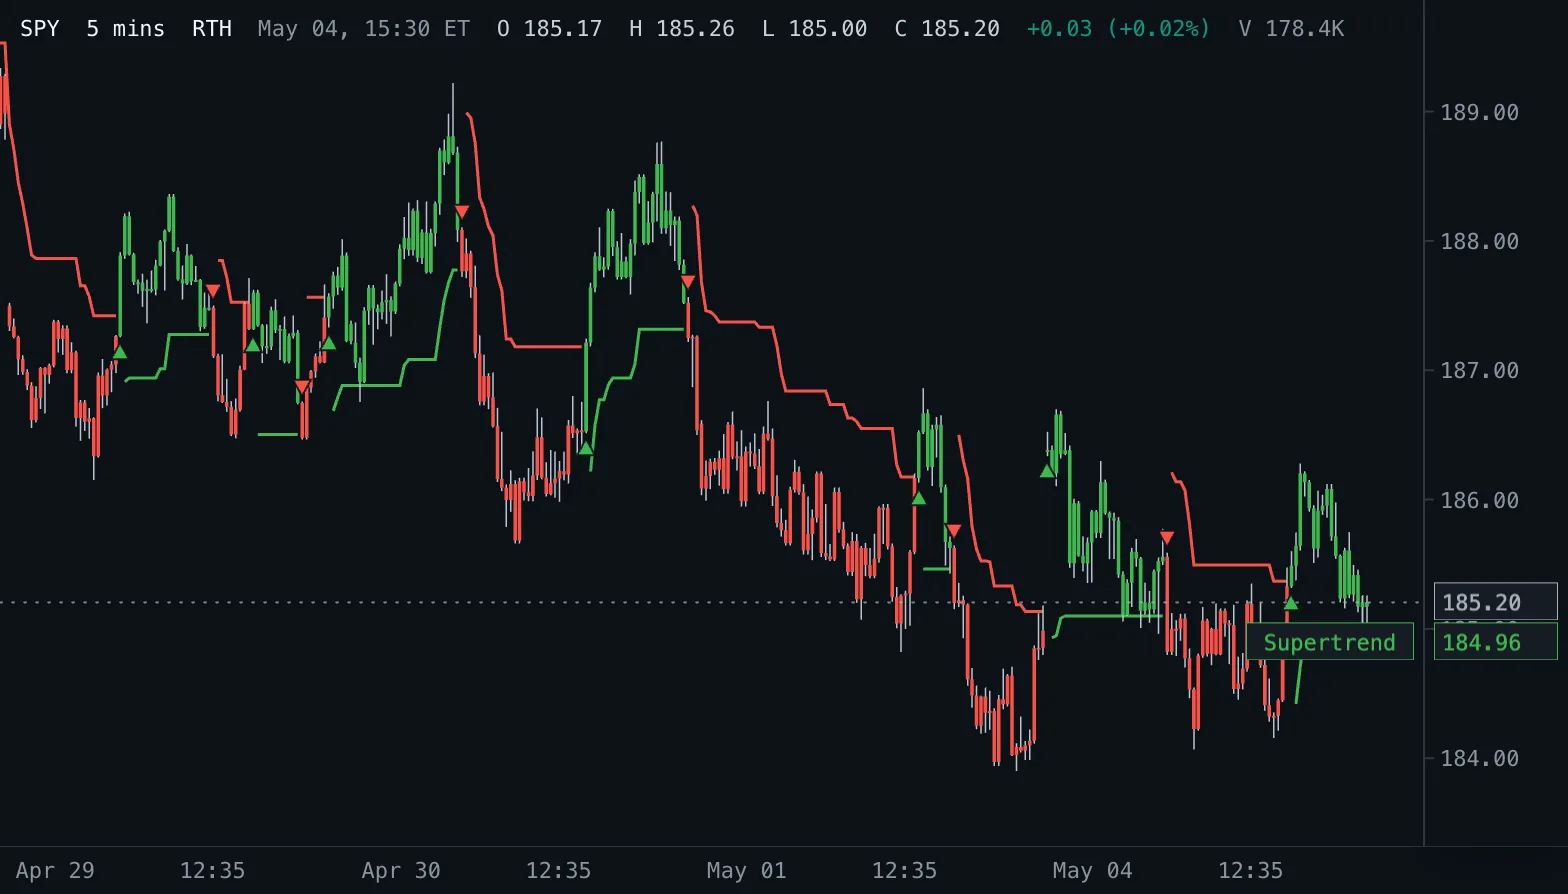
Supertrend Colored ST Colored
Supertrend as one line coloured by the trend, the candles coloured to match, and a triangle on every bar where the trend flips.
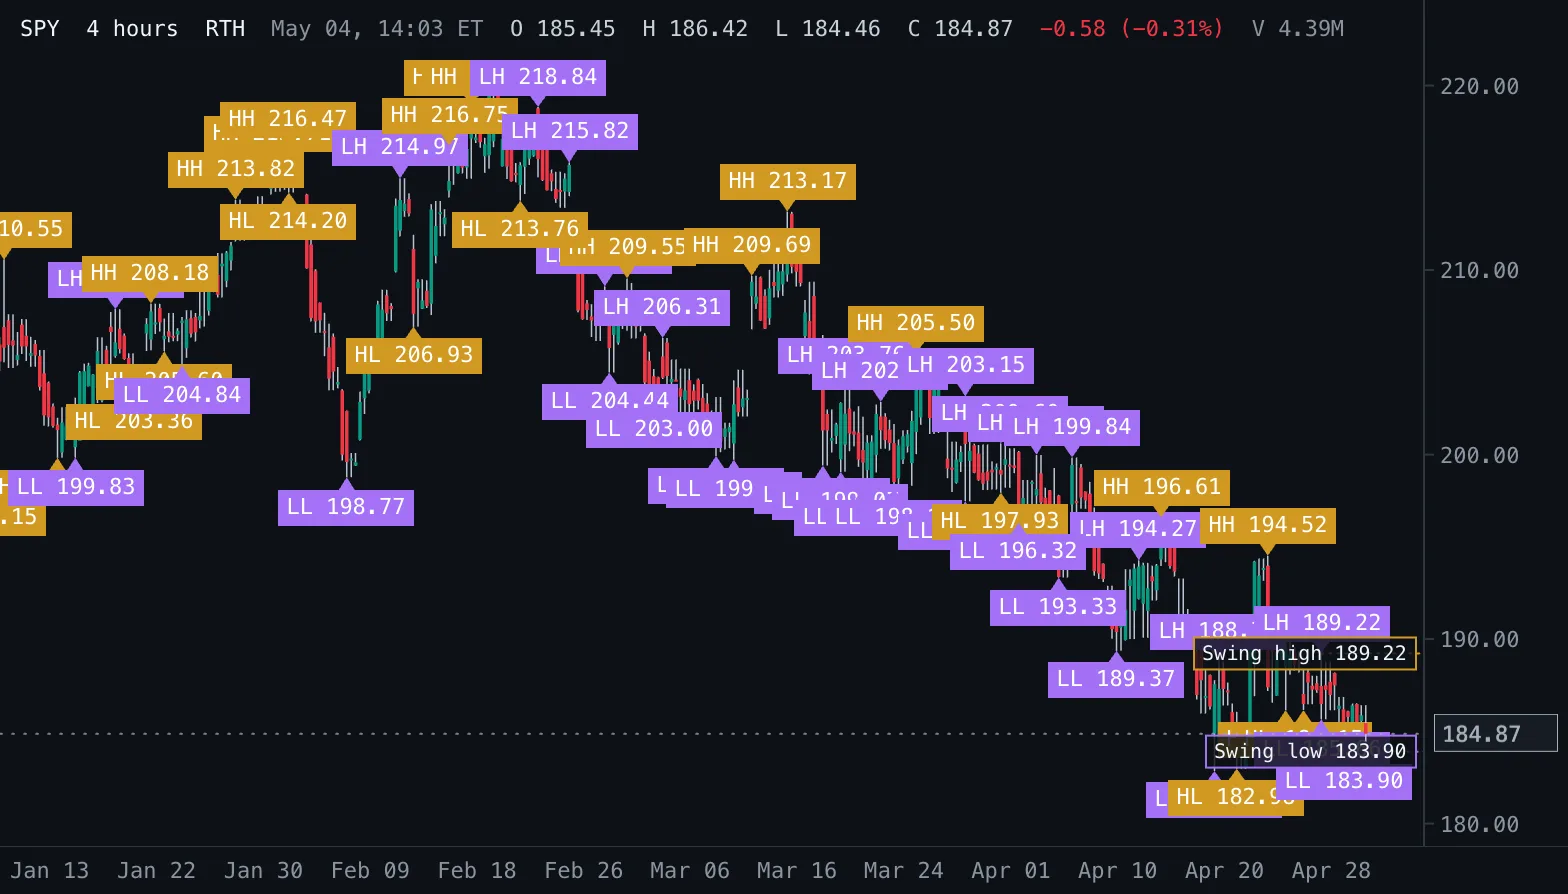
Swing Labels Swings
Labels each confirmed swing high and low with its price and whether it is higher or lower than the last one, and draws the latest swing high and low as levels with inline labels.
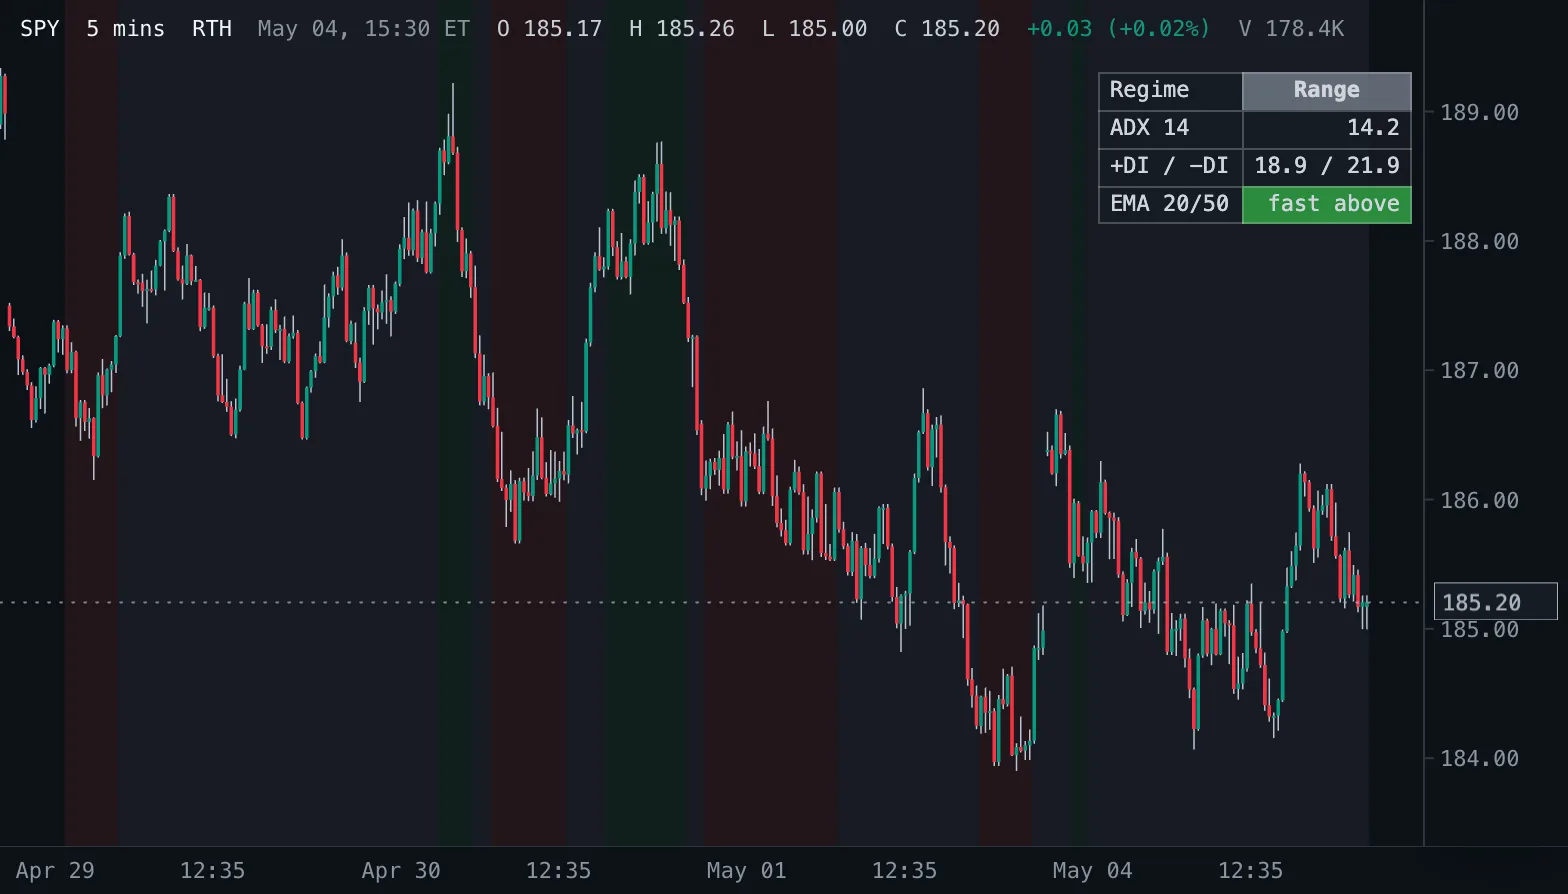
Trend Regime Table Regime
A table on the price pane with ADX, +DI and -DI (Wilder) and the EMA 20/50 state of the latest bar, and the pane shaded by the trend regime of every bar.
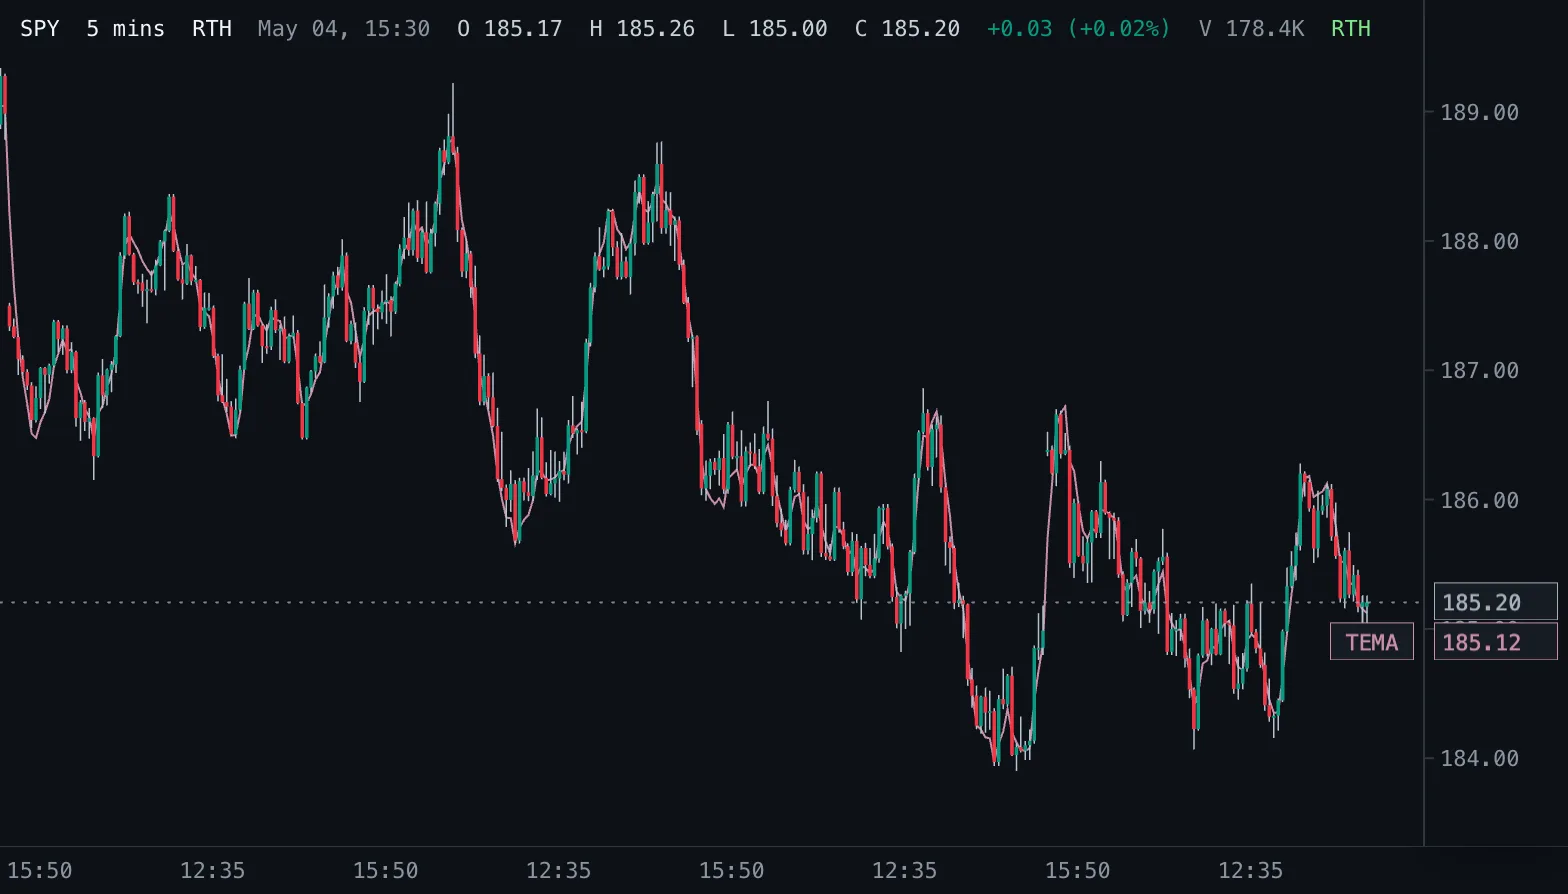
Triple Exponential Moving Average TEMA
Patrick Mulloy's triple exponential moving average: an EMA with its lag corrected twice, drawn on the candles.
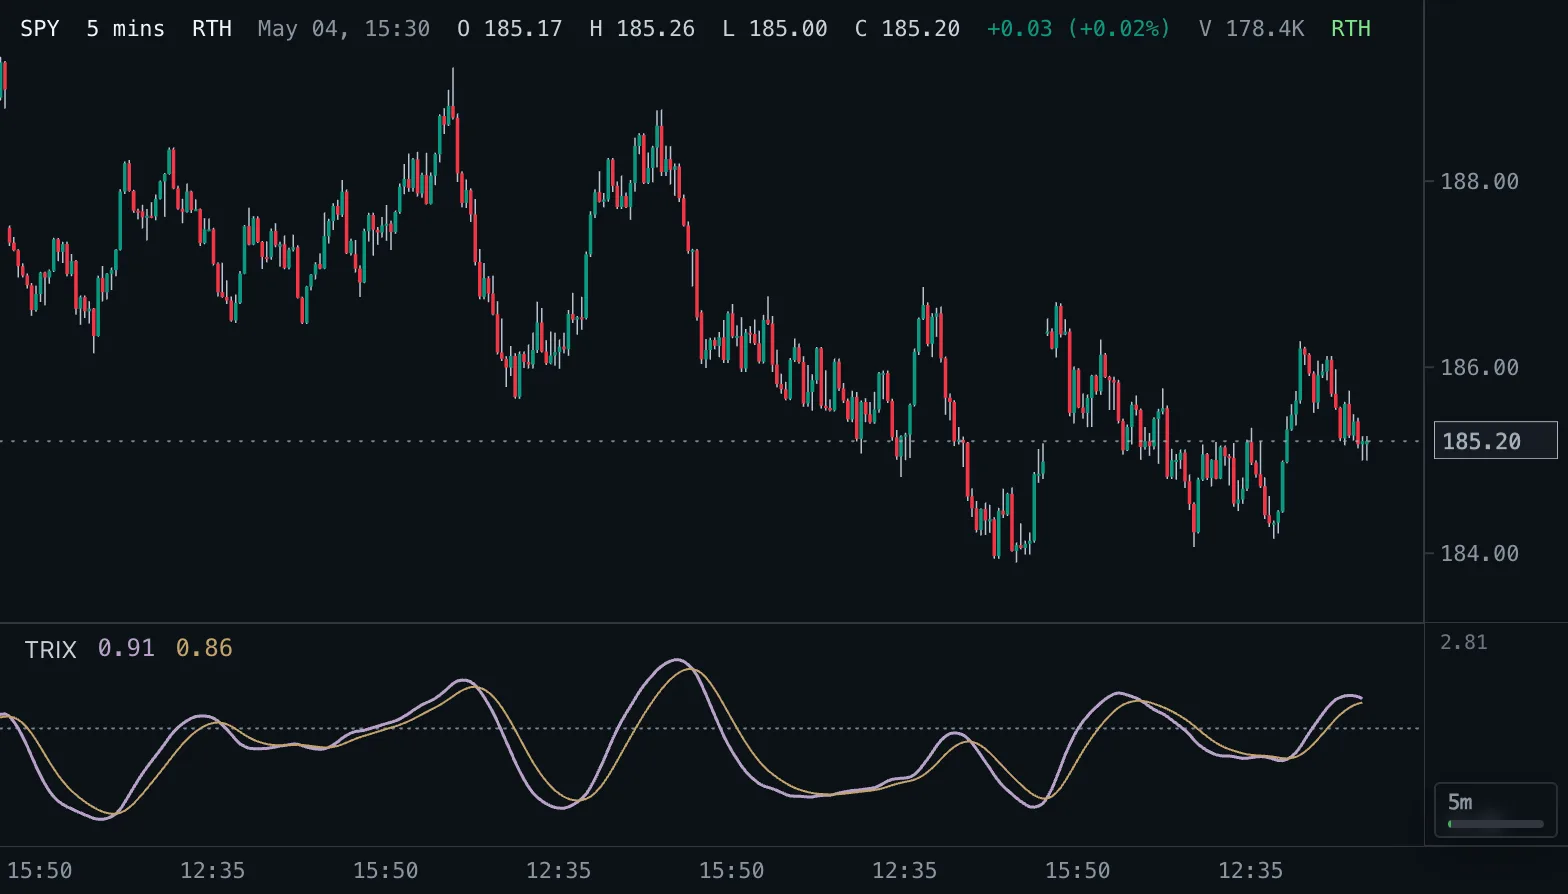
TRIX TRIX
One-bar change of a triple-smoothed exponential average of log price, scaled as on TradingView, with a signal line and a zero line.
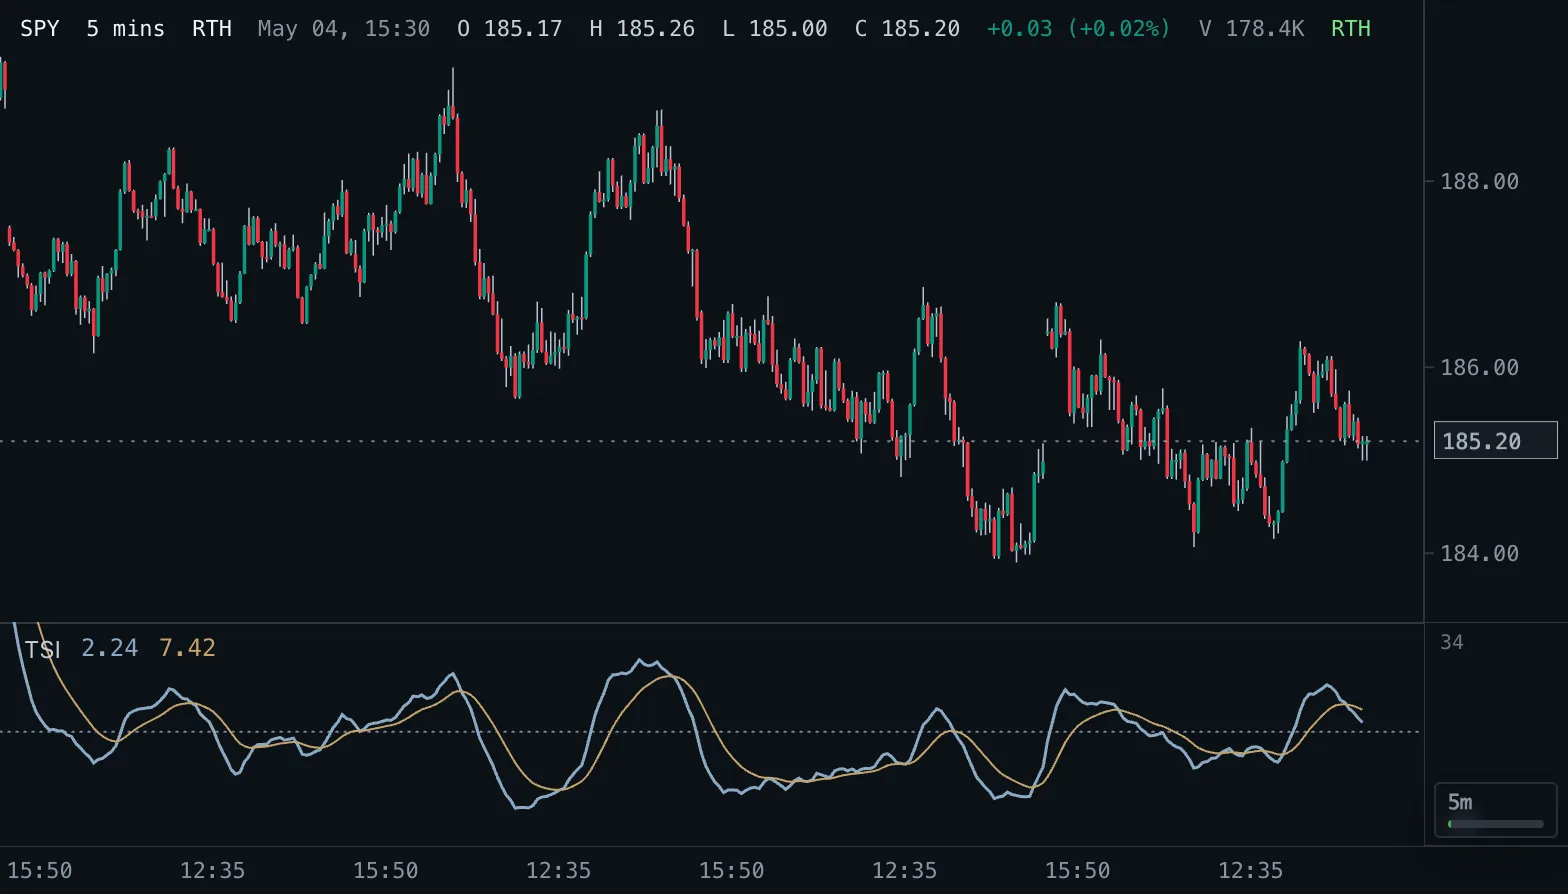
True Strength Index TSI
Double-smoothed price change divided by double-smoothed absolute price change, from -100 to 100, with a signal line.
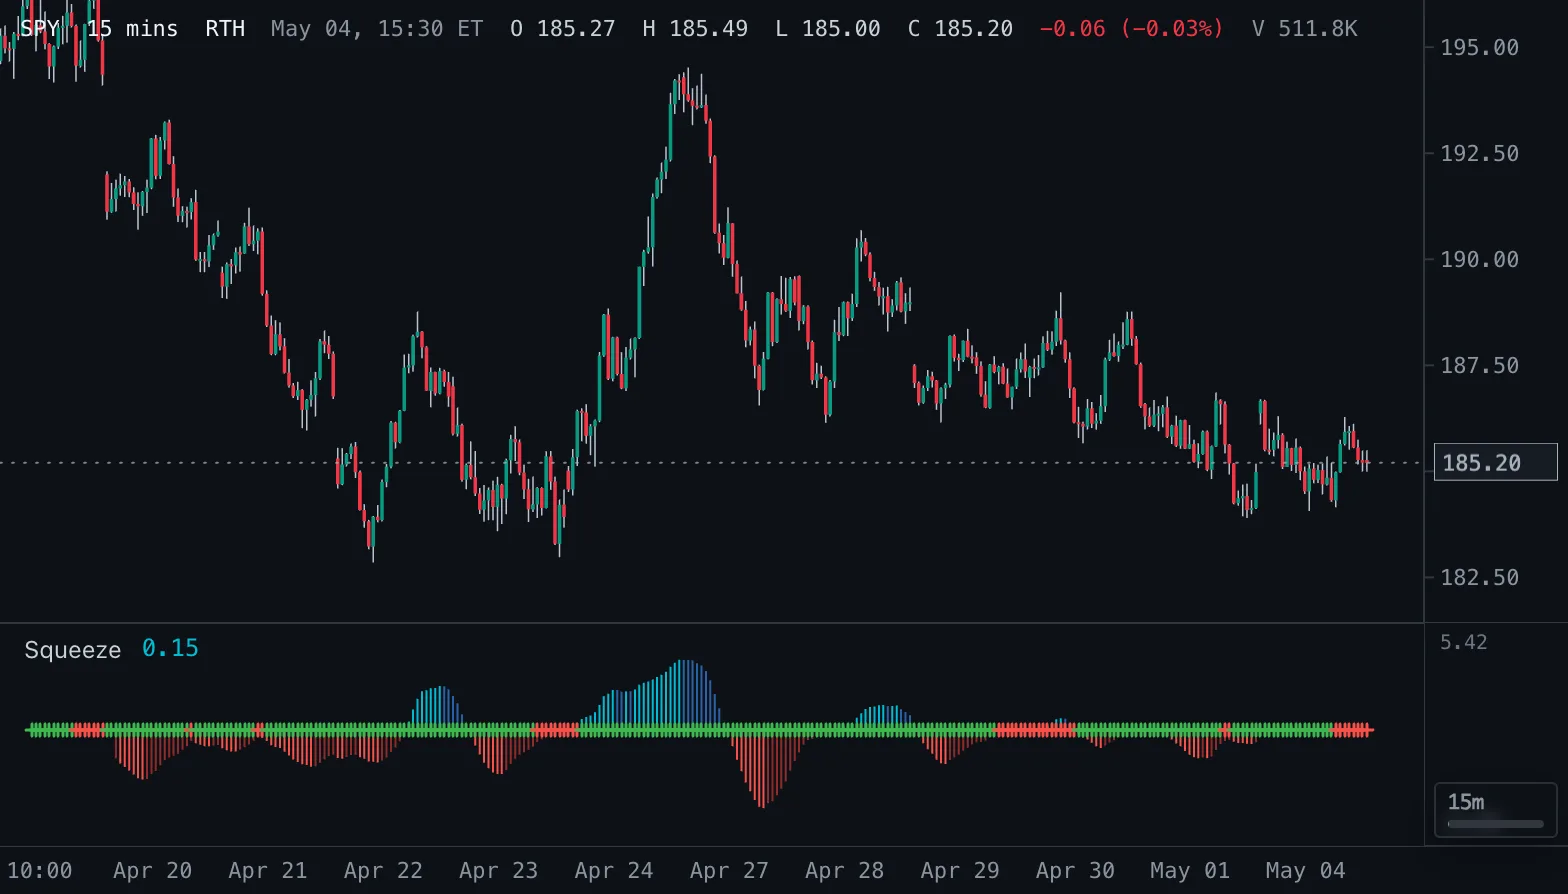
TTM Squeeze Squeeze
John Carter's TTM Squeeze: a momentum histogram in four colours and a dot on the zero line that is red while the Bollinger Bands sit inside the Keltner Channel.
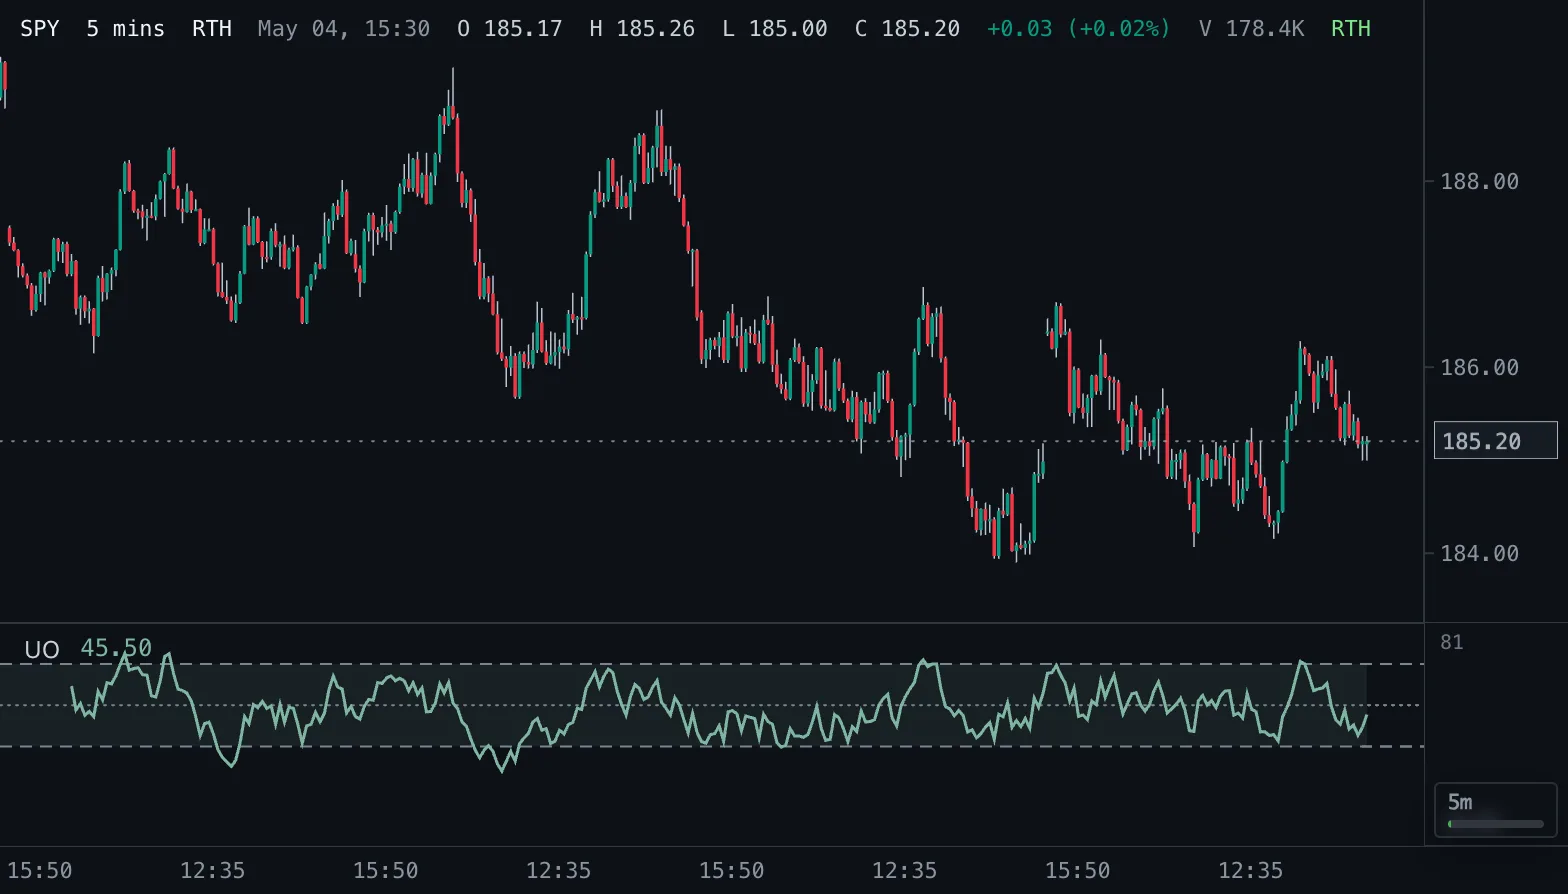
Ultimate Oscillator UO
Buying pressure relative to true range over three lookbacks, weighted 4:2:1, on a 0-100 scale with 70/30 bands.
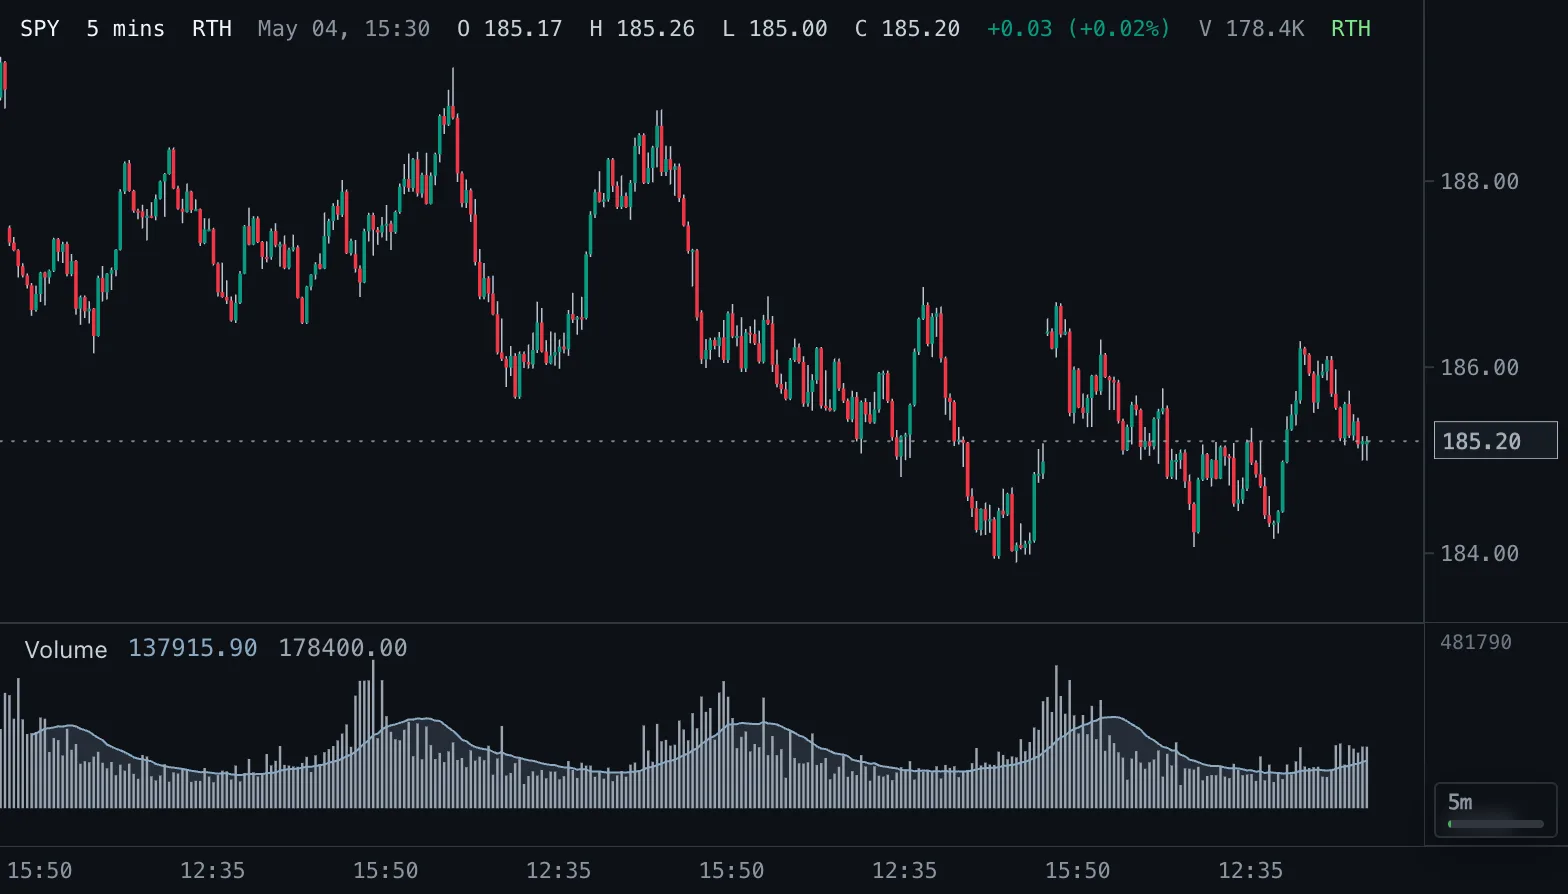
Volume Volume
Volume bars in their own pane with a rolling average line and a shaded cloud up to the average.
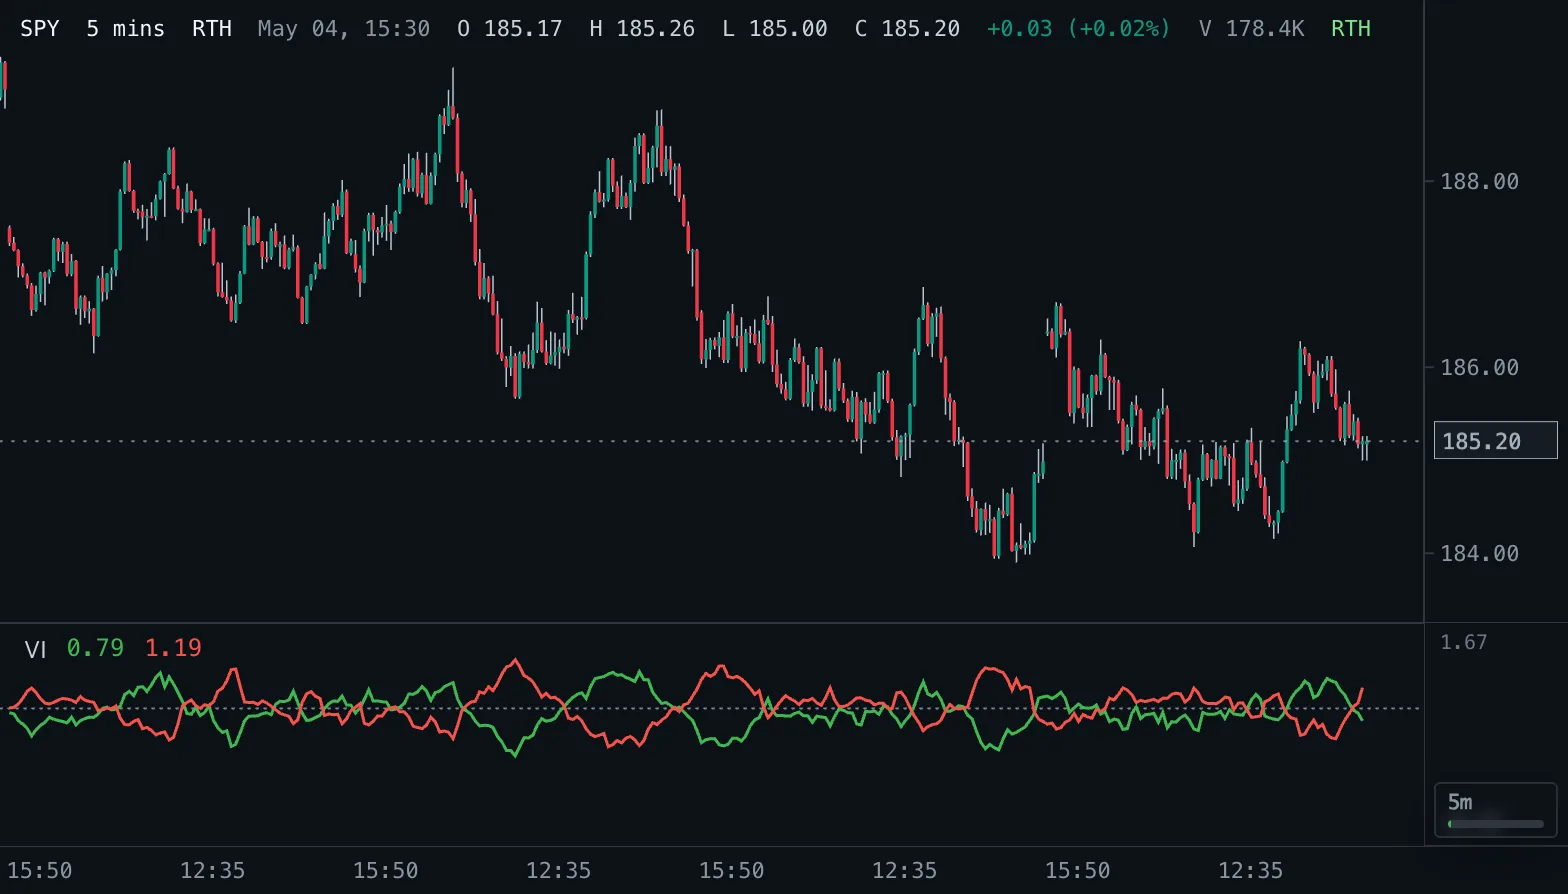
Vortex Indicator VI
VI+ and VI-: upward and downward trend movement relative to the true range, for spotting trend starts and reversals.
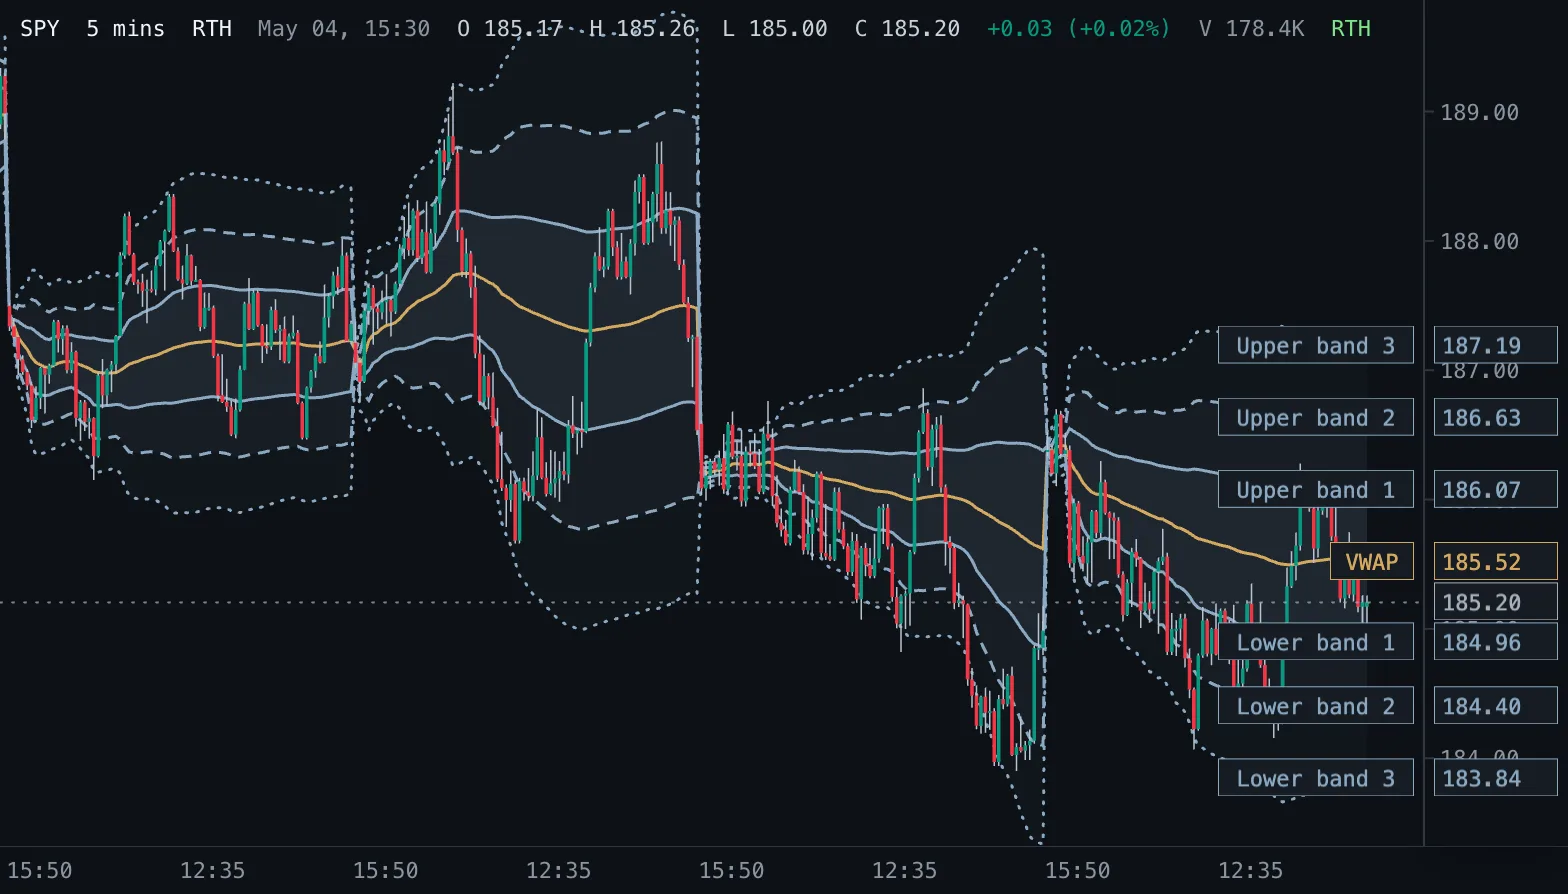
VWAP with Bands VWAP Bands
Session volume-weighted average price with up to three pairs of volume-weighted standard deviation bands.
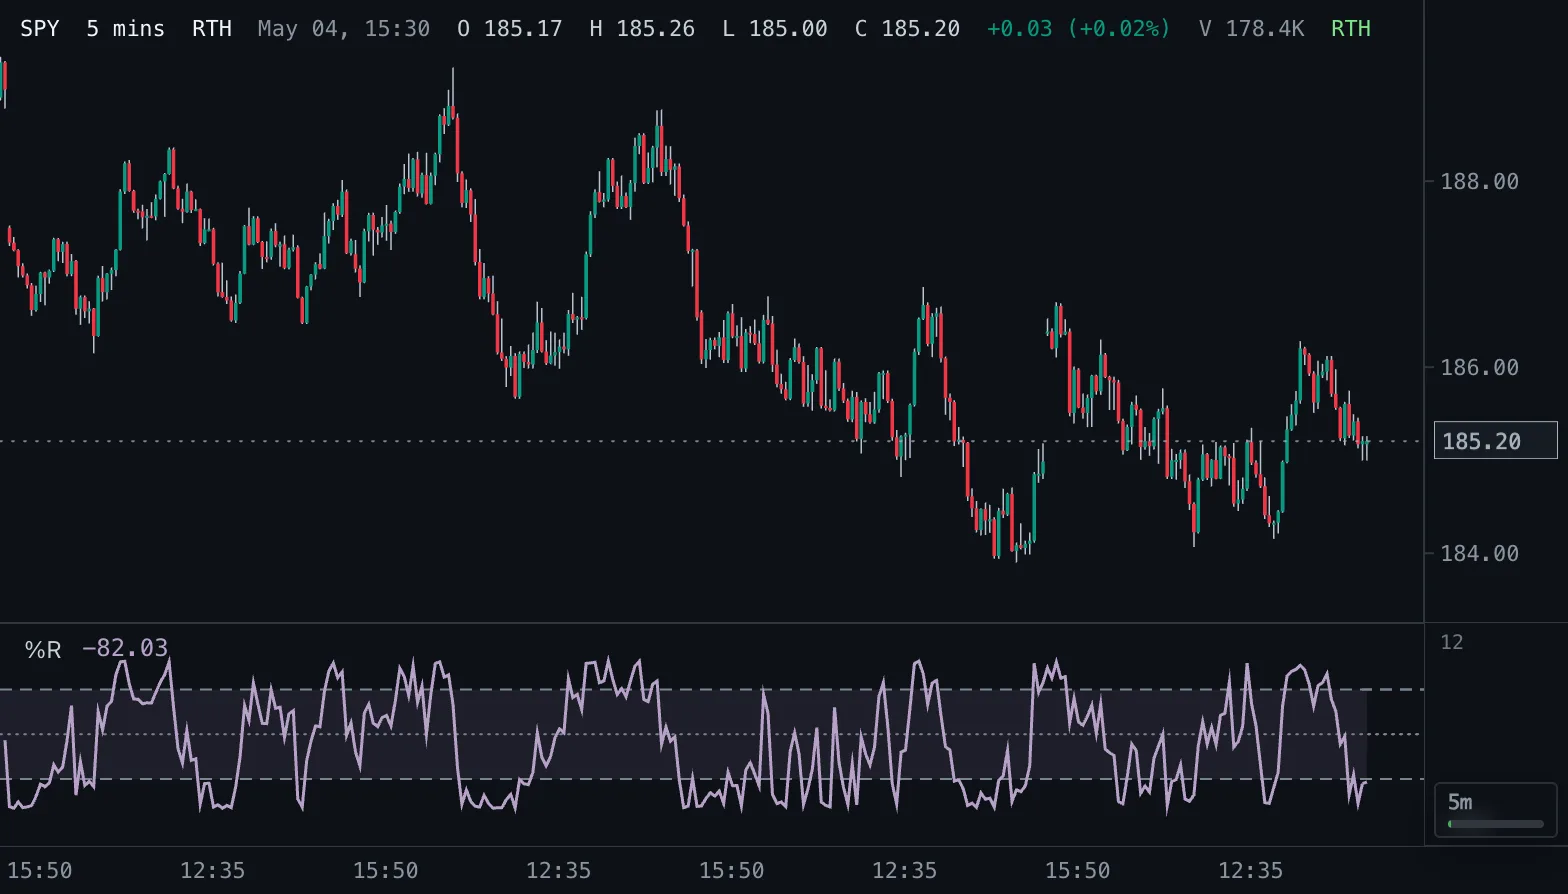
Williams %R %R
How far the close sits below the recent high, on a 0 to -100 scale, with -20 and -80 bands.
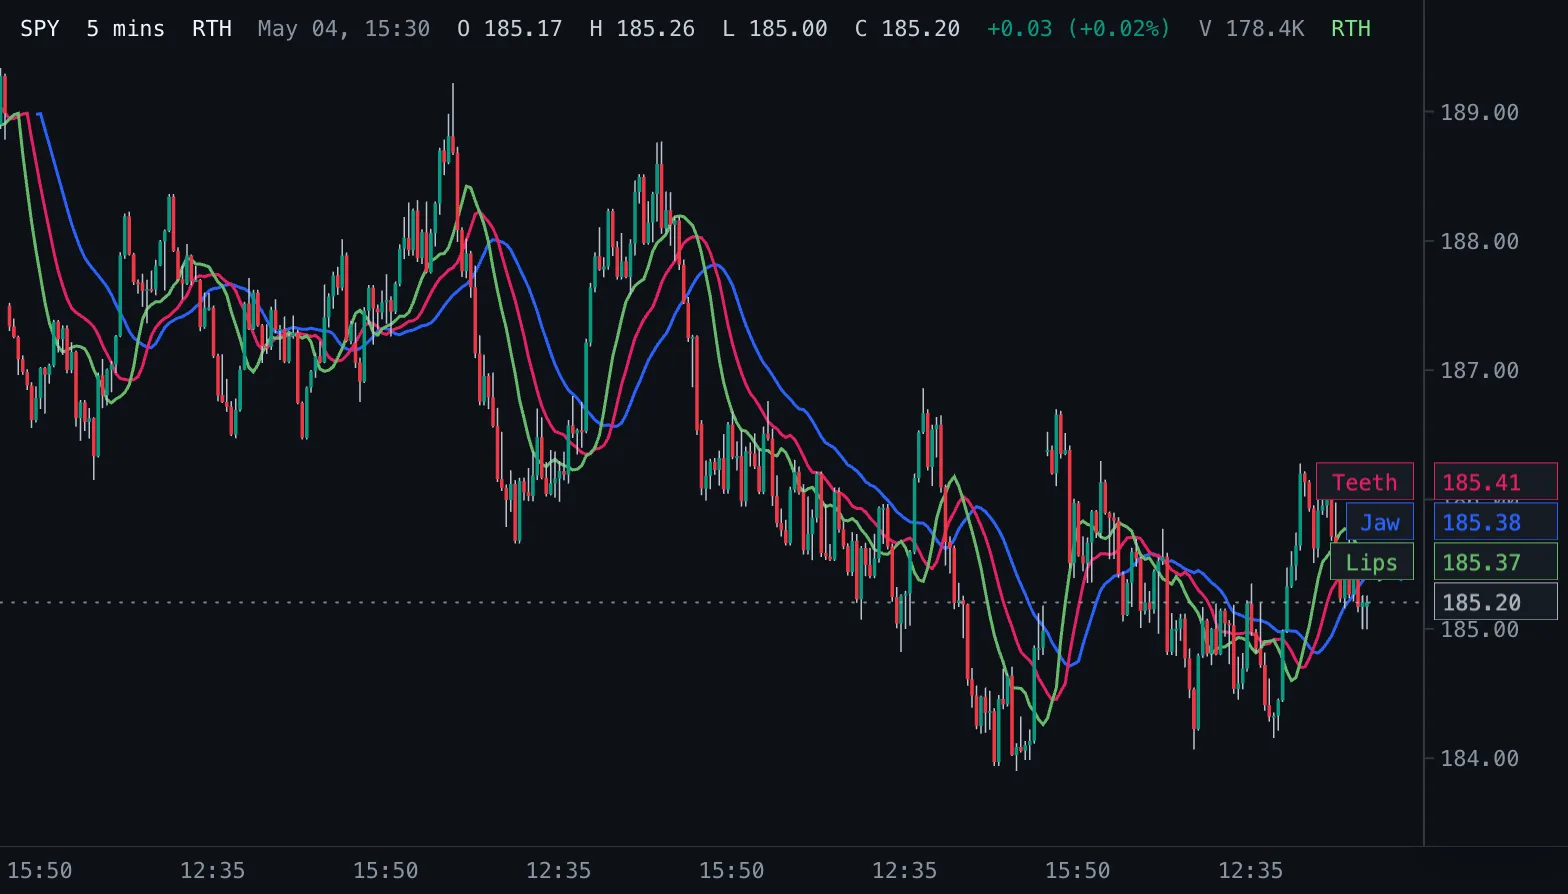
Williams Alligator Alligator
Bill Williams' jaw, teeth and lips: three smoothed averages of the median price, shifted forward, that intertwine in ranges and fan out in trends.
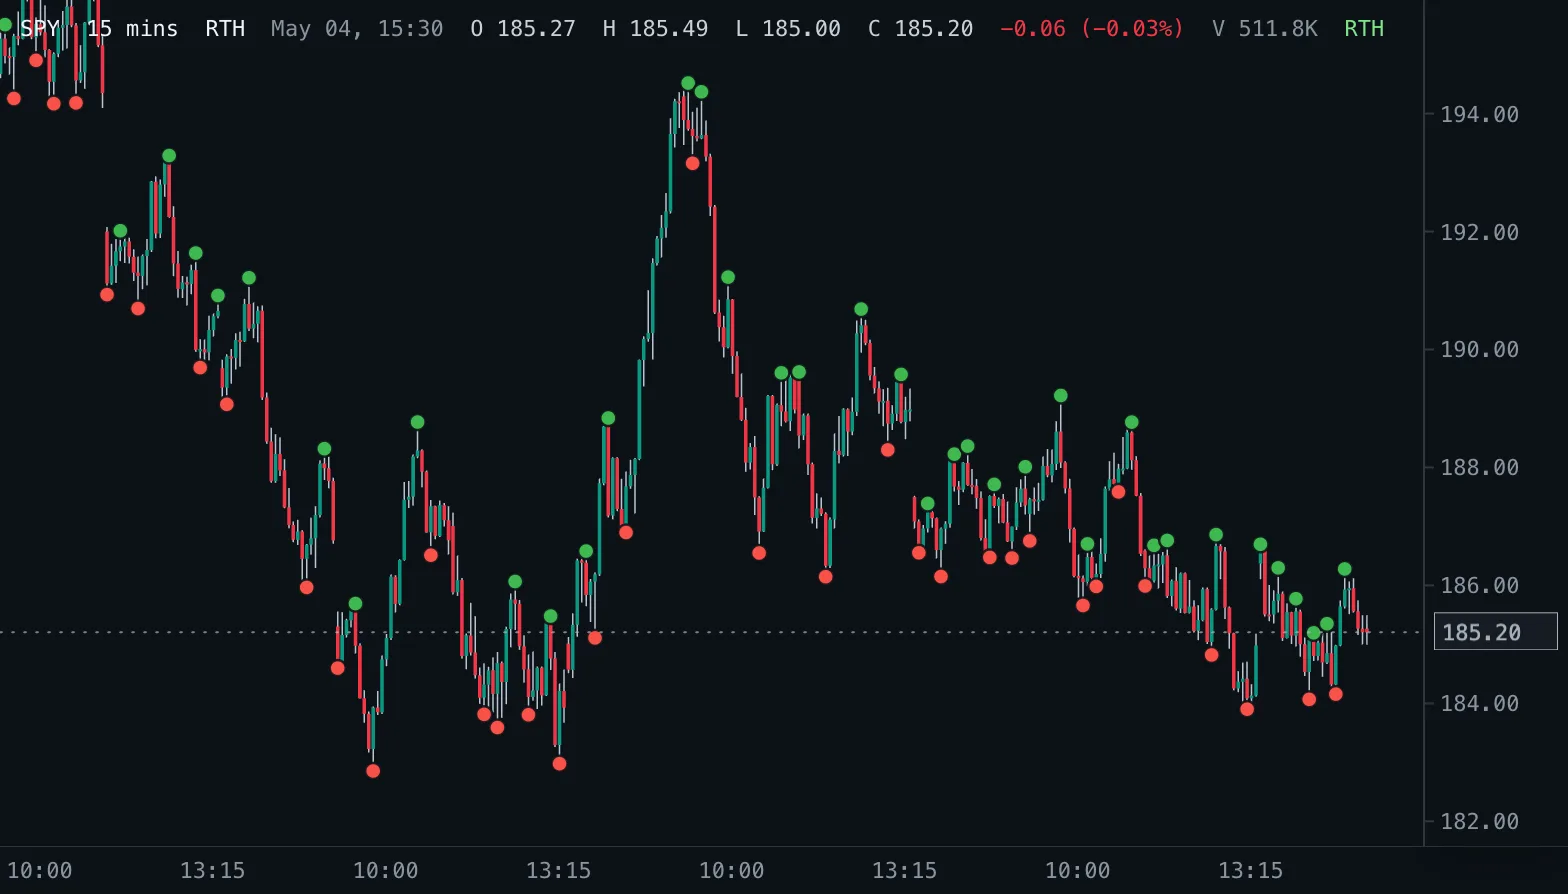
Williams Fractals Fractals
Bill Williams' up and down fractals: a high or low that stands above or below the bars on both sides, marked once the bars after it have closed.
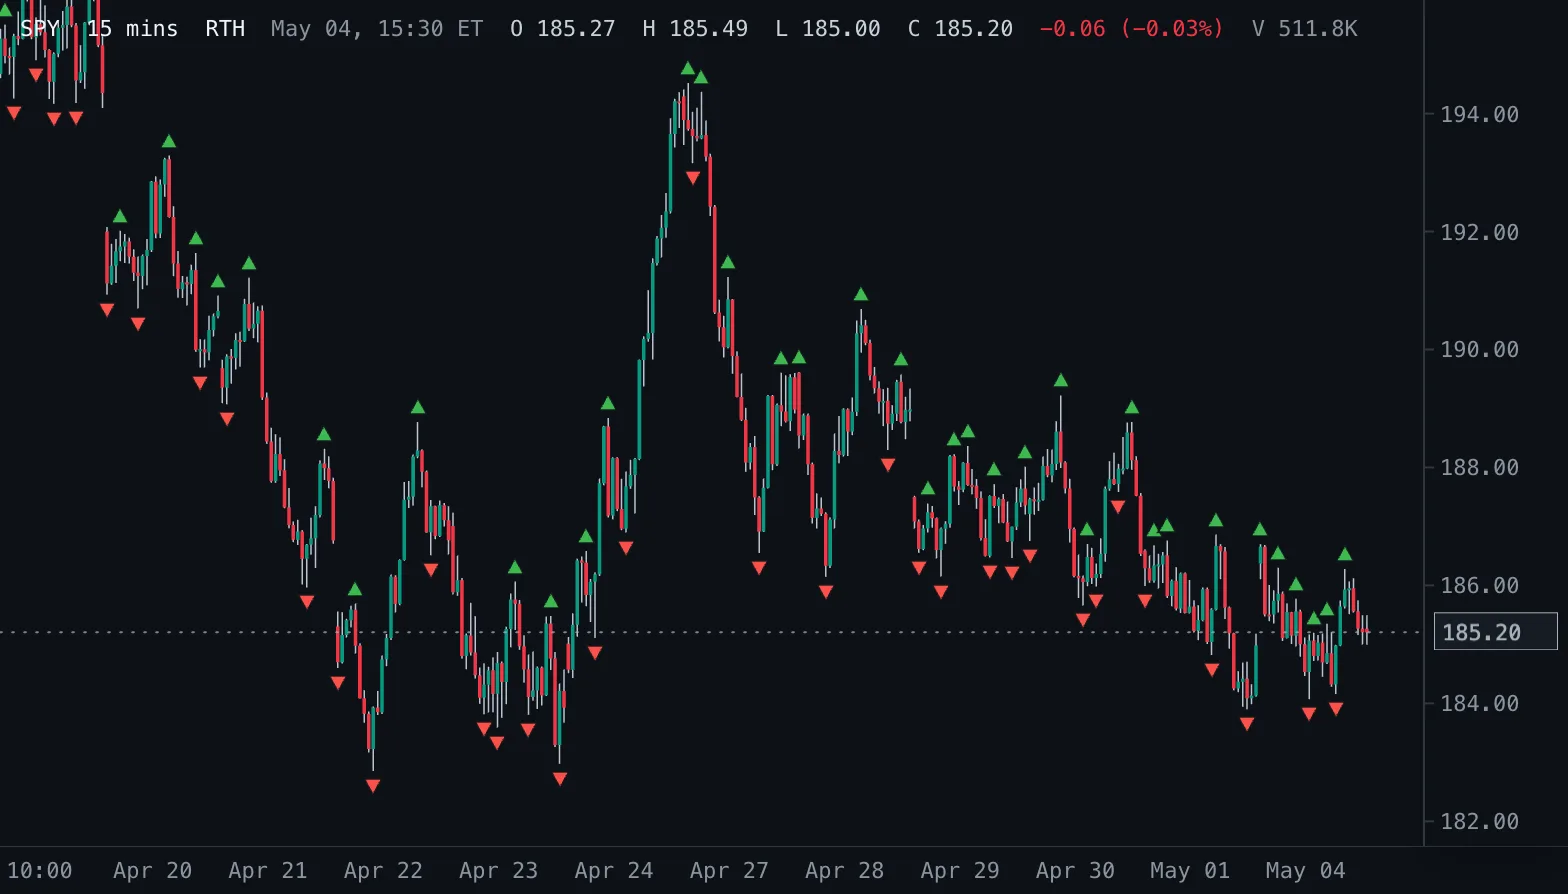
Williams Fractals Shapes Fractals
Bill Williams' fractals as triangles: one above every swing-high bar and one below every swing-low bar, hidden while the bars are too narrow to read them.
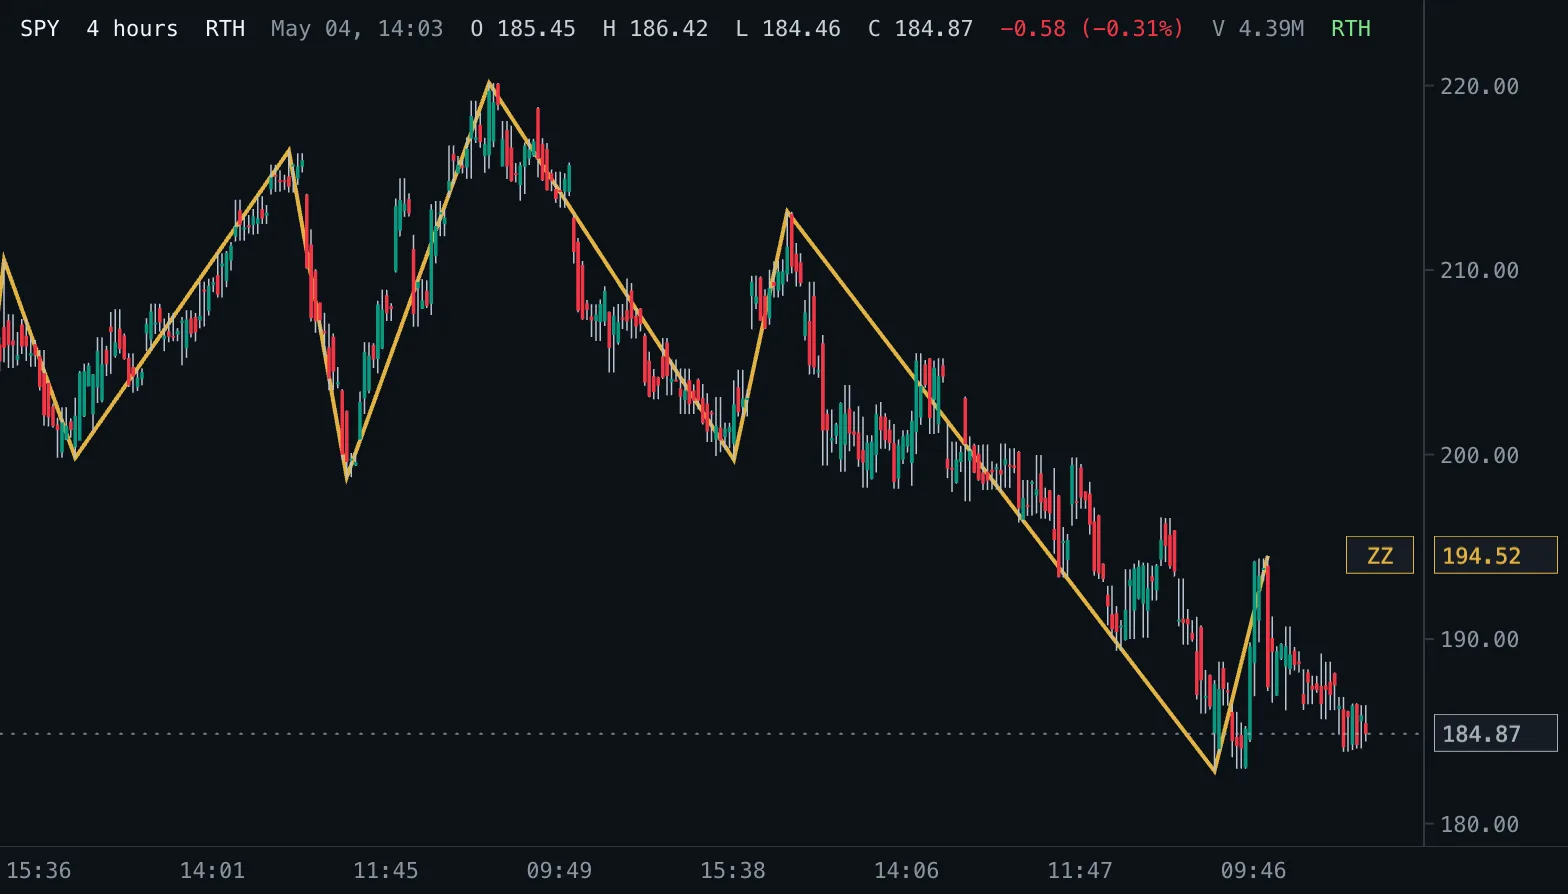
Zig Zag ZZ
A line through the confirmed swing highs and lows that filters out moves smaller than the deviation percent.
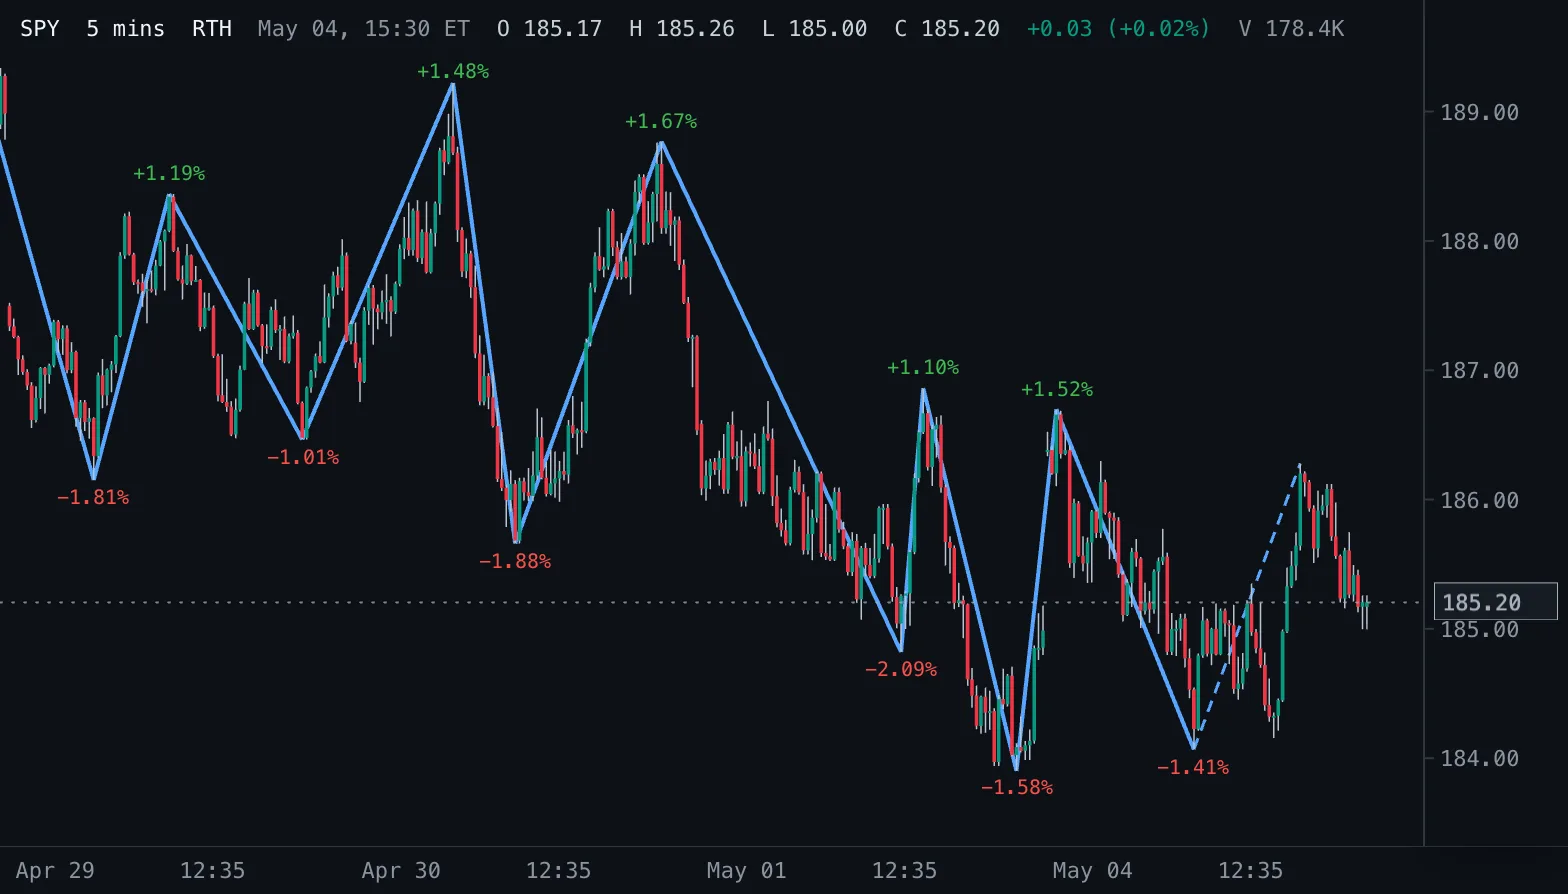
ZigZag Segments ZigZag %
The classic percentage ZigZag: straight lines between swing highs and lows that reverse by at least a threshold percentage, each swing labelled with its percentage move.
Try fewer filters or another word, or let an LLM write it
For tools and LLMs: the store is also available as catalog.llm.md and catalog.json.