Money Flow Index
Volume-weighted momentum oscillator from 0 to 100 that compares money flowing into rising and falling bars.
- MFI
- Built into Spectral
- Updates every tick
- Uses volume
- money flow index
- mfi
- volume rsi
- overbought
- oversold
- divergence
MIT-0: free to use, change and share, no attribution needed. What you build from it is yours.
Already in Spectral: add it from the Indicators toolbox. The file here is the same indicator written as a custom indicator, to change or learn from. Installed, it appears next to the built-in one, marked Custom.
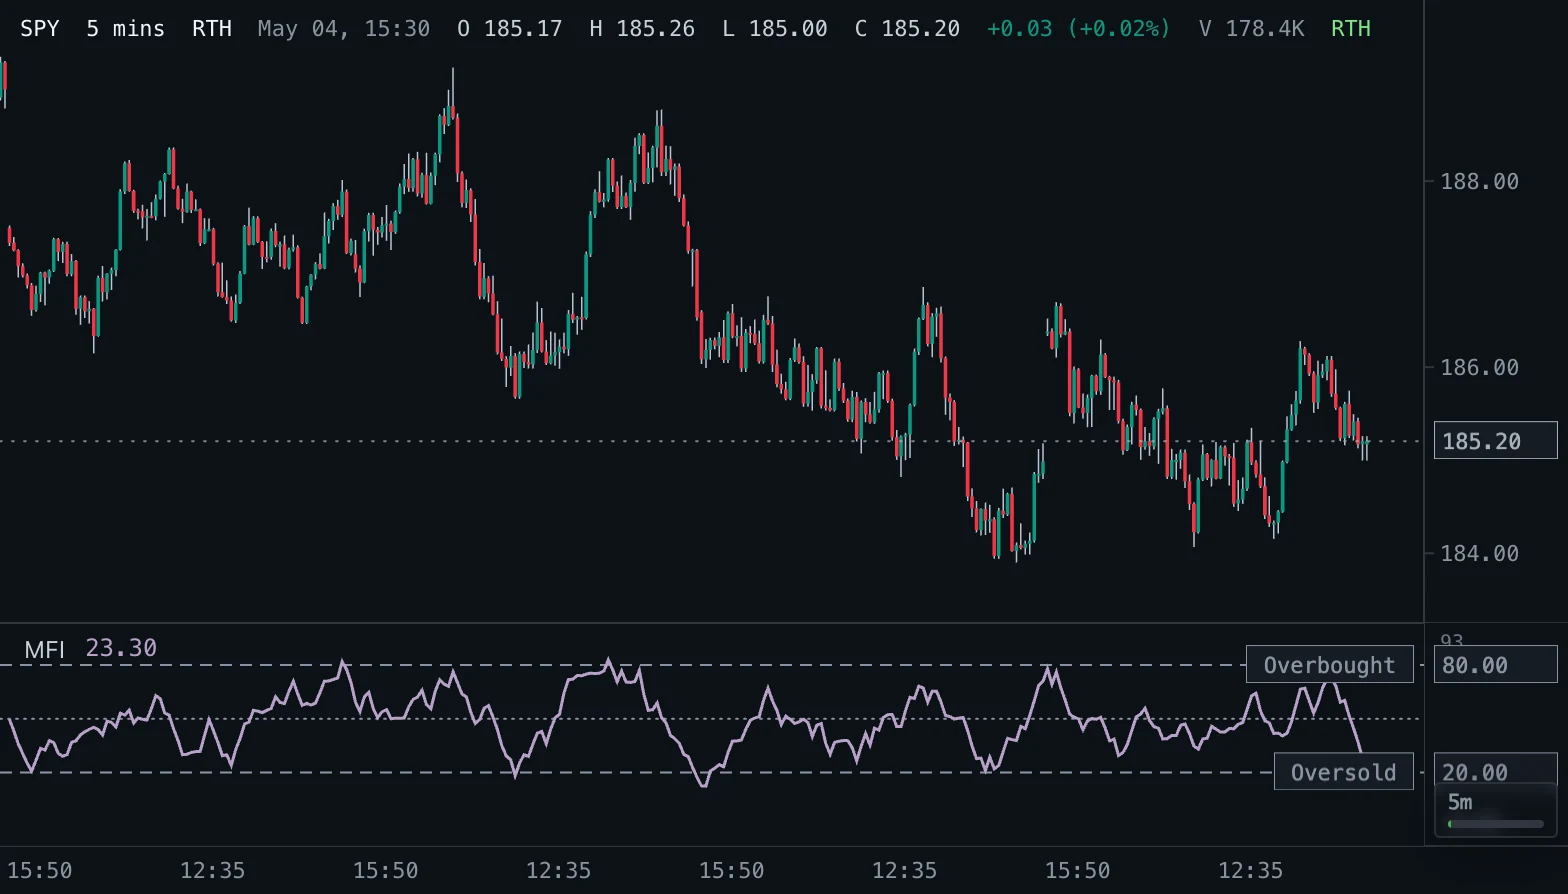
Overview
The Money Flow Index is a volume-weighted cousin of the RSI. For every bar it takes the typical price (the average of high, low and close) and multiplies it by the bar's volume to get the raw money flow. If the typical price is higher than on the previous bar the flow counts as positive, if it is lower the flow counts as negative, and if it is unchanged the bar is left out.
Over the chosen length the positive and negative flows are added up, and MFI = 100 - 100 / (1 + positive sum / negative sum). The result moves between 0 and 100.
How to read it
Readings above the overbought line (80 by default) mean that nearly all recent money flow went into rising bars; readings below the oversold line (20) mean it went into falling bars. Both are conditions of stretched buying or selling, not signals on their own: in a strong trend MFI can stay at an extreme for a long time.
The more useful signals are divergences: price making a new high while MFI makes a lower high warns that the move is running on less volume, and the same at lows. A cross of the middle line at 50 shows which side of the money flow has the upper hand. Because volume is part of the formula, MFI is most reliable on instruments whose volume is meaningful.
Settings and limitations
Length is the number of bars added up; 14 is the standard. A shorter length makes MFI quicker and noisier, a longer one smoother. The first value appears after Length bars, because each bar is compared with the one before it.
Overbought level and Oversold level move the two threshold lines (80 and 20 by default; 90 and 10 flag only extreme readings). The middle line at 50 can be switched off. The presets offer a fast length of 7, a slow length of 21 and the 90 and 10 thresholds.
Notes
This is the standard Money Flow Index as published by Gene Quong and Avrum Soudack, and the same calculation TradingView uses (its typical price is hlc3, bars with an unchanged typical price are excluded). When the negative flow in the window is zero, MFI is 100; when both flows are zero (no volume, or no change in typical price, in the whole window) it shows no value, as on TradingView.
Settings
Each setting appears in the indicator's settings panel in Spectral, next to a color setting for every output.
| Setting | Type | Default | Range or options | What it does |
|---|---|---|---|---|
| Length | Whole number | 14 | 2 – 500 | Number of bars over which positive and negative money flow are added up. |
| Overbought level | Number | 80 | 50 – 100, step 1 | Line drawn as the overbought threshold. |
| Oversold level | Number | 20 | 0 – 50, step 1 | Line drawn as the oversold threshold. |
| Middle line (50) | On / off | On | — | Draw the neutral line at 50. |
Presets
Each preset is its own entry in the Indicators toolbox, with these settings changed.
| Toolbox entry | Short name | Settings |
|---|---|---|
| MFI (7) | MFI 7 | Length: 7 |
| MFI (21) | MFI 21 | Length: 21 |
| MFI (14, 90/10) | MFI 90/10 | Length: 14Overbought level: 90Oversold level: 10 |
What it draws
Lines
- MFIsolid · 1.5 px · primary
#B7A1C8
Levels
- Overboughtdashed · 1 px · value on the axis
#8A94A3 - Oversolddashed · 1 px · value on the axis
#8A94A3 - Middledotted · 1 px
#8A94A3
Source
Save it as mfi.js and add it with Indicators → Custom indicators → Add file…. The format is explained in the custom indicators guide.
// Copyright (c) 2026 Spectral
// SPDX-License-Identifier: MIT-0
// Free to use, copy, modify and share: https://spectral.trade/docs/custom-indicators/LICENSE.txt
/** @type {import('./spectral-indicator').IndicatorV2} */
export default {
  schemaVersion: 2,
  id: 'mfi',
  name: 'Money Flow Index',
  shortName: 'MFI',
  version: '1.0.0',
  author: 'Spectral',
  description: 'Volume-weighted momentum oscillator from 0 to 100 that compares money flowing into rising and falling bars.',
  pane: 'oscillator',
  live: { lookback: 'length' },
  usesVolume: true,
  inputs: {
    length: { type: 'integer', label: 'Length', default: 14, min: 2, max: 500, description: 'Number of bars over which positive and negative money flow are added up.' },
    overbought: { type: 'number', label: 'Overbought level', default: 80, min: 50, max: 100, step: 1, description: 'Line drawn as the overbought threshold.' },
    oversold: { type: 'number', label: 'Oversold level', default: 20, min: 0, max: 50, step: 1, description: 'Line drawn as the oversold threshold.' },
    showMiddle: { type: 'boolean', label: 'Middle line (50)', default: true, description: 'Draw the neutral line at 50.' },
  },
  plots: {
    mfi: { label: 'MFI', color: '#B7A1C8', lineWidth: 1.5, primary: true },
  },
  levels: {
    overbought: { label: 'Overbought', color: '#8A94A3', lineStyle: 'dashed', showValue: true },
    oversold: { label: 'Oversold', color: '#8A94A3', lineStyle: 'dashed', showValue: true },
    middle: { label: 'Middle', color: '#8A94A3', lineStyle: 'dotted' },
  },
  presets: [
    { id: 'length-7', name: 'MFI (7)', shortName: 'MFI 7', inputs: { length: 7 } },
    { id: 'length-21', name: 'MFI (21)', shortName: 'MFI 21', inputs: { length: 21 } },
    { id: 'levels-90-10', name: 'MFI (14, 90/10)', shortName: 'MFI 90/10', inputs: { length: 14, overbought: 90, oversold: 10 } },
  ],
  docs: {
    overview: 'The Money Flow Index is a volume-weighted cousin of the RSI. For every bar it takes the typical price (the average of high, low and close) and multiplies it by the bar\'s volume to get the raw money flow. If the typical price is higher than on the previous bar the flow counts as positive, if it is lower the flow counts as negative, and if it is unchanged the bar is left out.\n\nOver the chosen length the positive and negative flows are added up, and MFI = 100 - 100 / (1 + positive sum / negative sum). The result moves between 0 and 100.',
    howToRead: 'Readings above the overbought line (80 by default) mean that nearly all recent money flow went into rising bars; readings below the oversold line (20) mean it went into falling bars. Both are conditions of stretched buying or selling, not signals on their own: in a strong trend MFI can stay at an extreme for a long time.\n\nThe more useful signals are divergences: price making a new high while MFI makes a lower high warns that the move is running on less volume, and the same at lows. A cross of the middle line at 50 shows which side of the money flow has the upper hand. Because volume is part of the formula, MFI is most reliable on instruments whose volume is meaningful.',
    settings: 'Length is the number of bars added up; 14 is the standard. A shorter length makes MFI quicker and noisier, a longer one smoother. The first value appears after Length bars, because each bar is compared with the one before it.\n\nOverbought level and Oversold level move the two threshold lines (80 and 20 by default; 90 and 10 flag only extreme readings). The middle line at 50 can be switched off. The presets offer a fast length of 7, a slow length of 21 and the 90 and 10 thresholds.',
    notes: 'This is the standard Money Flow Index as published by Gene Quong and Avrum Soudack, and the same calculation TradingView uses (its typical price is hlc3, bars with an unchanged typical price are excluded). When the negative flow in the window is zero, MFI is 100; when both flows are zero (no volume, or no change in typical price, in the whole window) it shows no value, as on TradingView.',
  },
  calculate(ctx) {
    const { bars, inputs, ta } = ctx;
    const length = inputs.length;
    const typicals = bars.map((bar) => (bar.high + bar.low + bar.close) / 3);
    // Per bar: the raw money flow on the side of its direction (up or down from the previous typical price). An
    // unchanged price, the first bar and a bar without volume count on neither side, so a window of zero-volume
    // bars has exactly no flow.
    const positive = bars.map(() => 0);
    const negative = bars.map(() => 0);
    for (let index = 1; index < bars.length; index += 1) {
      const volume = Number(bars[index].volume);
      const flow = typicals[index] * (Number.isFinite(volume) && volume > 0 ? volume : 0);
      if (!(flow > 0)) continue;
      if (typicals[index] > typicals[index - 1]) positive[index] = flow;
      else if (typicals[index] < typicals[index - 1]) negative[index] = flow;
    }
    const positiveSums = ta.sum(positive, length);
    const negativeSums = ta.sum(negative, length);
    // The first value needs Length flows after the first bar.
    const mfi = positiveSums.map((positiveSum, index) => {
      const negativeSum = negativeSums[index];
      if (index < length || positiveSum === null || negativeSum === null) return null;
      if (negativeSum > 0) return Math.min(100, Math.max(0, 100 - 100 / (1 + positiveSum / negativeSum)));
      return positiveSum > 0 ? 100 : null;
    });
    return {
      plots: { mfi },
      levels: { overbought: inputs.overbought, oversold: inputs.oversold, middle: inputs.showMiddle ? 50 : null },
    };
  },
};
Adapt it with an LLM
Paste this into your assistant and replace the second-to-last line with the change you want.
Start from this Spectral custom indicator: https://spectral.trade/indicators/mfi.js
Format reference: https://spectral.trade/docs/custom-indicators.llm.md
Keep the file format and every rule of the reference; give the result a new id, name, shortName and version, and update docs and input descriptions to match.
Keep its live updates exact and fast (section "Fast live updates" of the reference): carry values from bar to bar only through ctx.ta, and raise live.lookback if the change reads further back; Spectral rejects a file whose live updates differ from a full recalculation or are too slow.
Change I want: <describe the change>
Answer with the complete file in one code block, ready to save as <id>.js.
Related indicators
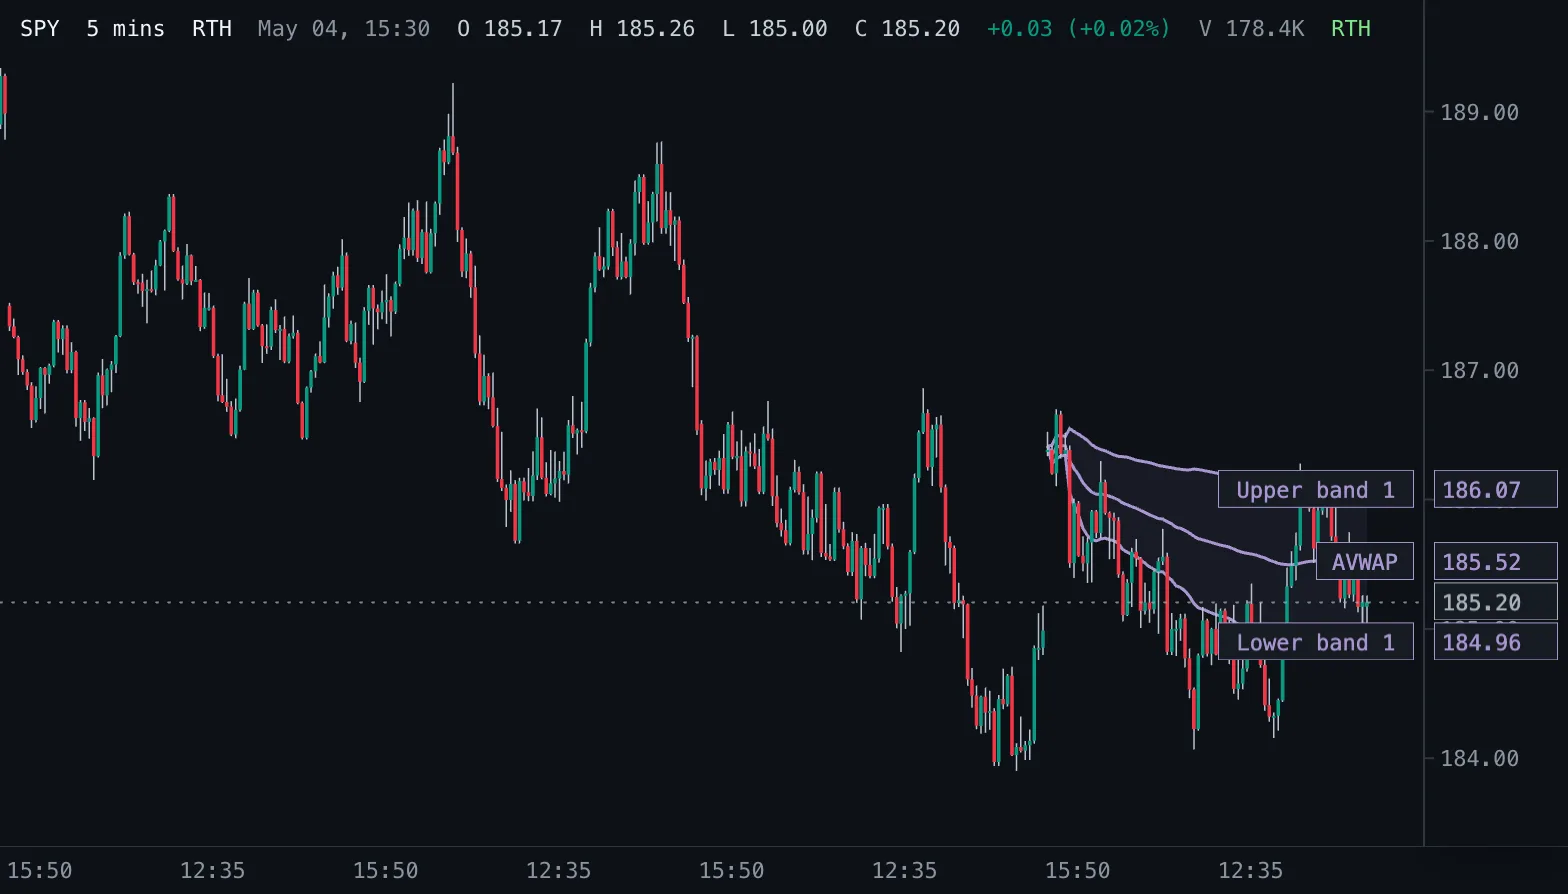
Anchored VWAP AVWAP
Volume-weighted average price counted from a chosen start time, with optional volume-weighted standard deviation bands.
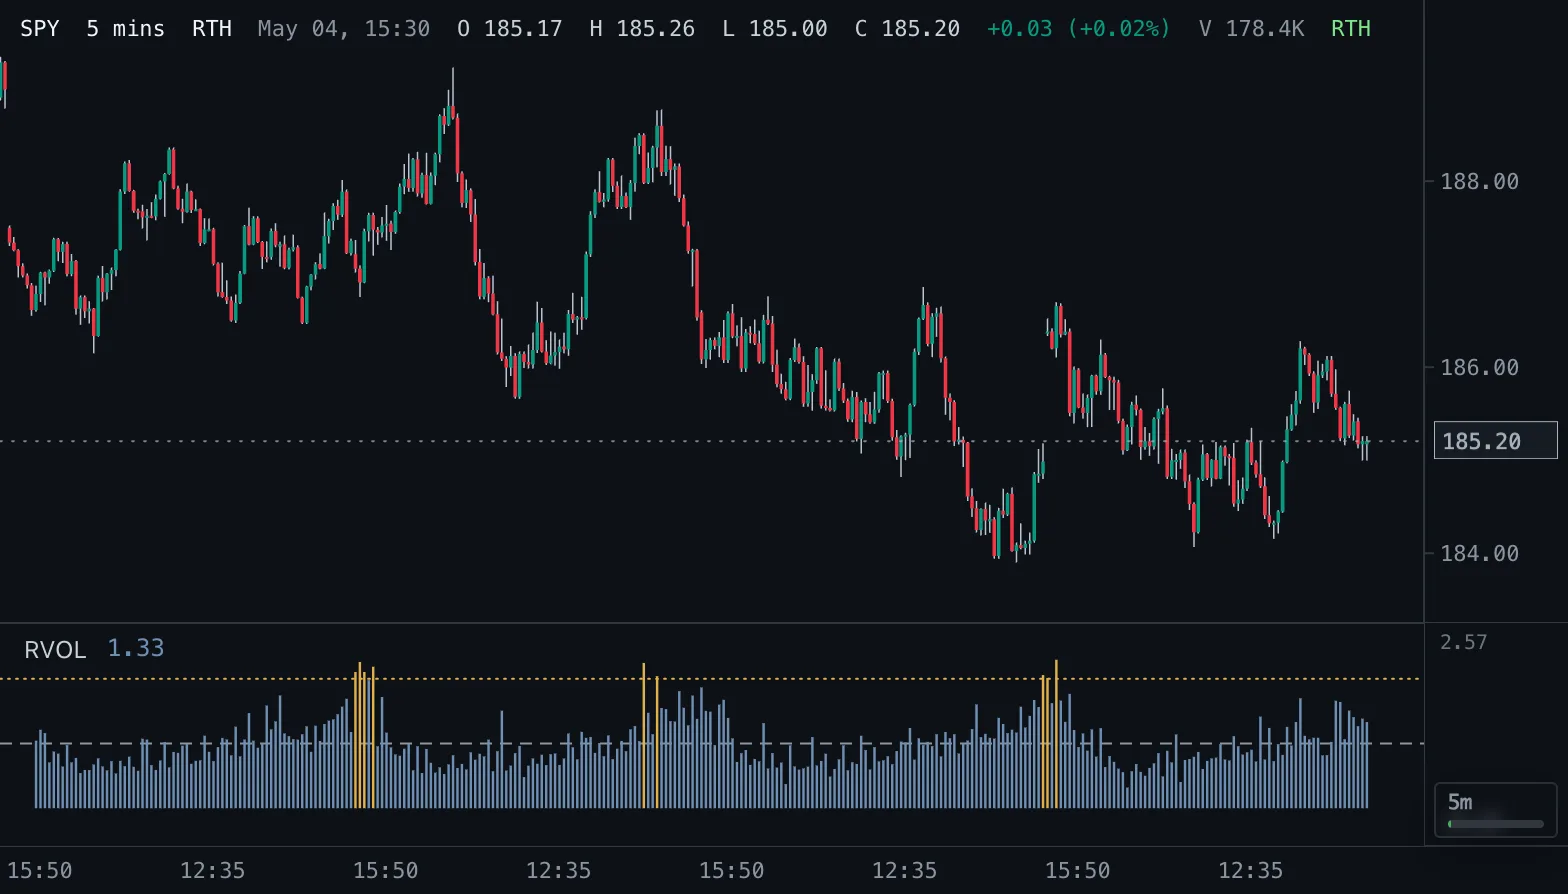
Relative Volume RVOL
Volume as a multiple of normal: against the average of the prior bars, or against the same time of day on earlier sessions.
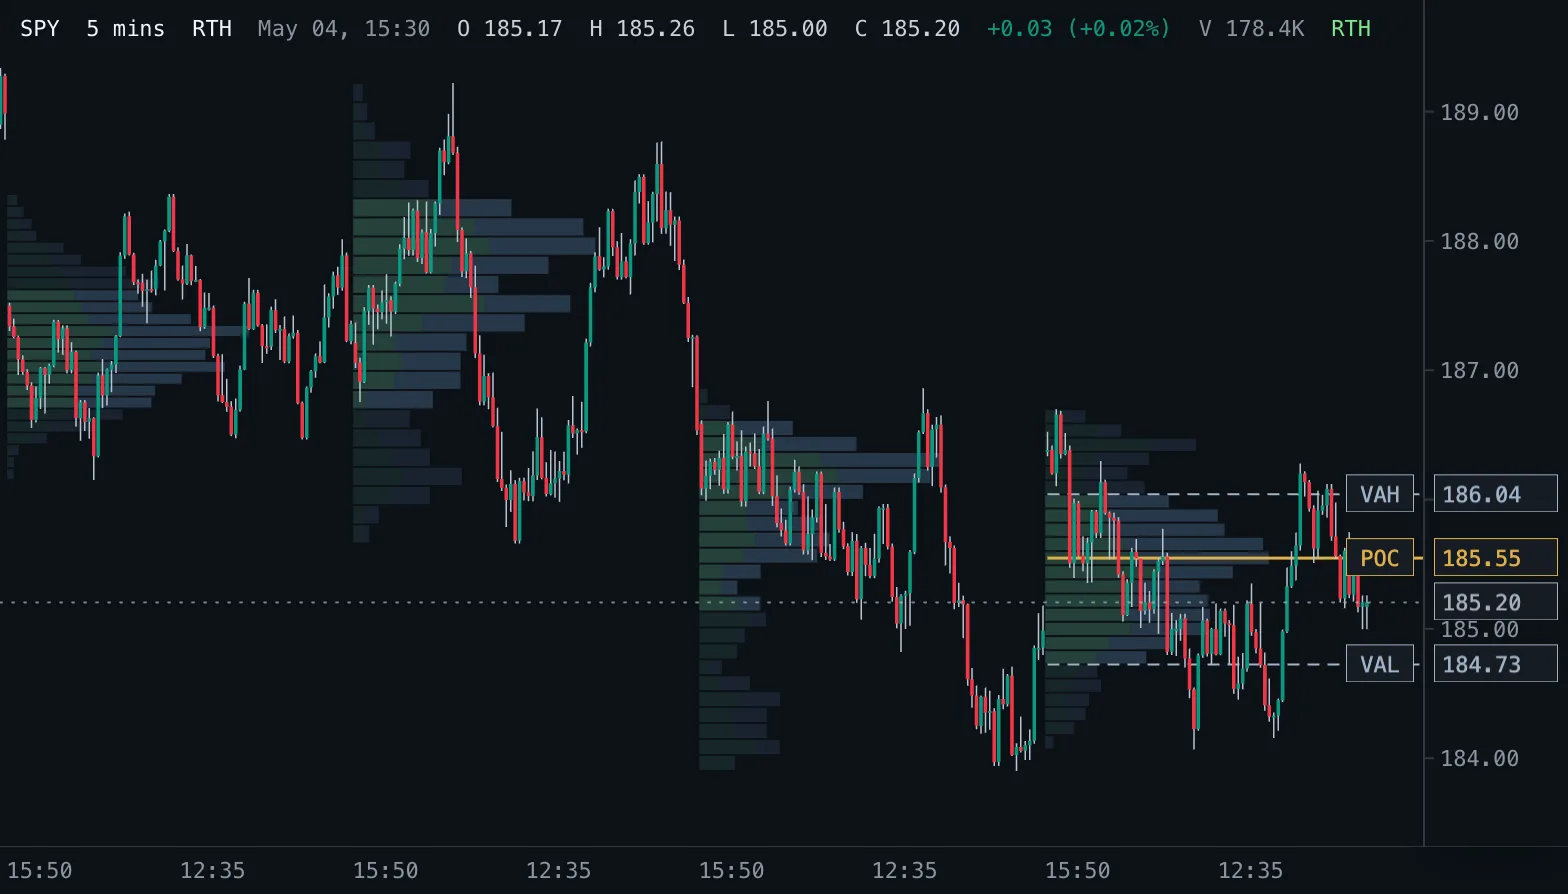
Volume Profile VP
Volume traded at each price as horizontal rows, per session, over a fixed range or for the bars on screen, with point of control and value area.