Multi-Timeframe Trend Dashboard
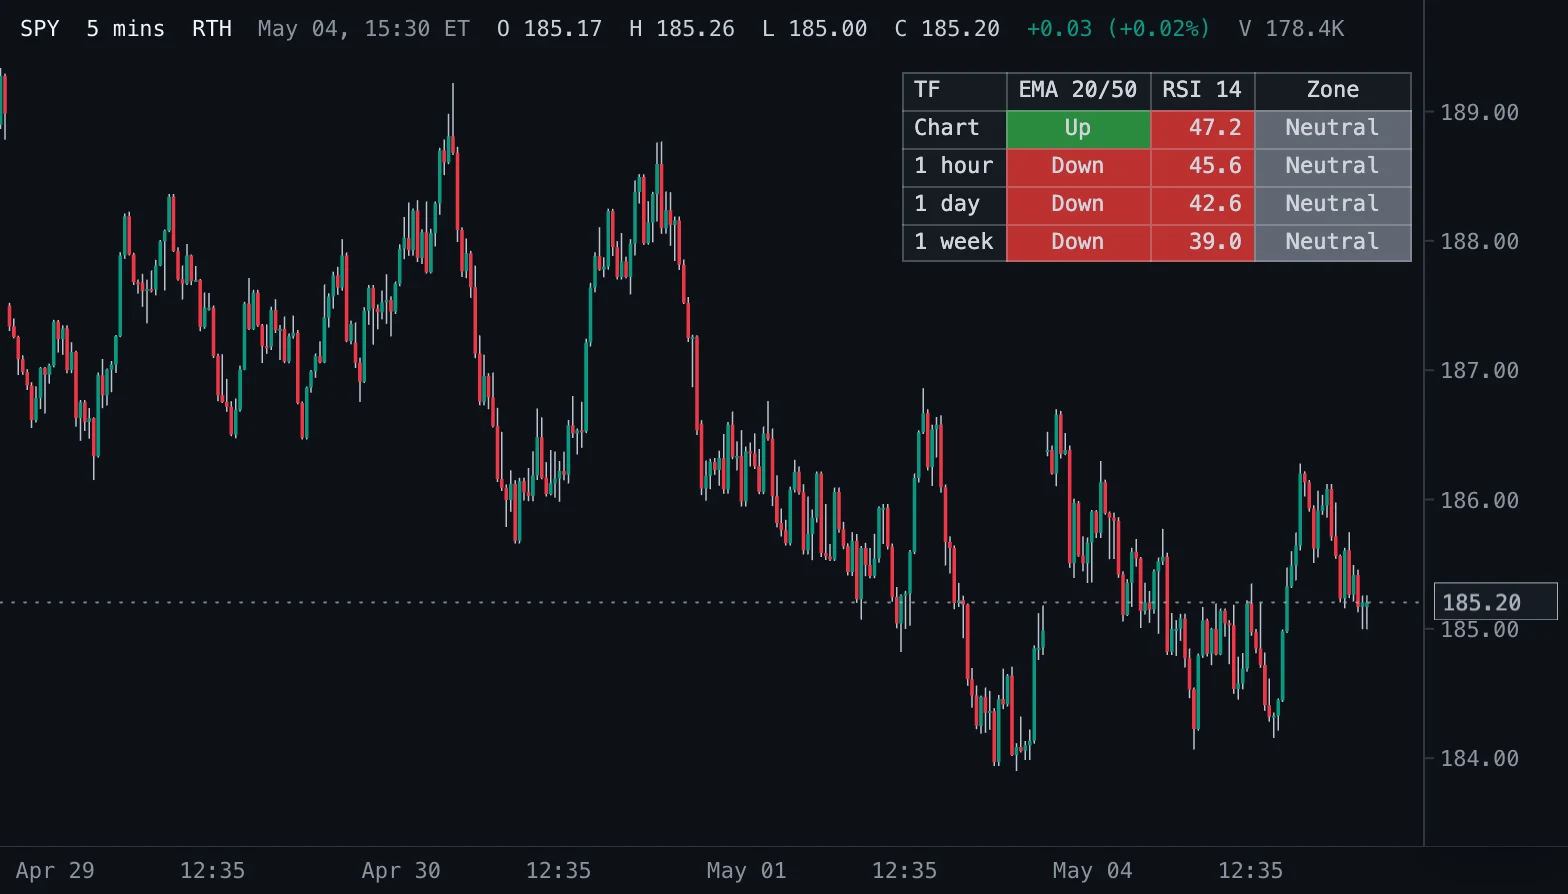
A table with the EMA 20/50 trend and the RSI 14 of the chart's bars and of hourly, daily and weekly bars, each cell coloured by its state.
- MTF Trend
- Updates at bar close
- multi-timeframe
- mtf
- dashboard
- table
- ema
- rsi
MIT-0: free to use, change and share, no attribution needed. What you build from it is yours.
Overview
One table for the trend on four timeframes: the chart's own bars and hourly, daily and weekly bars of the same symbol. For each it shows whether the EMA 20 of the close is above or below the EMA 50, the 14-bar RSI (J. Welles Wilder, 1978) and whether that RSI is overbought or oversold.
How to read it
Up (green): the fast EMA is above the slow one; Down (red): below. The RSI cell is green above 50 and red below. Overbought means the RSI is at or above 70, oversold at or below 30 (Wilder's levels). Timeframes that agree describe a strong trend; a lower timeframe against a higher one is often a pullback. Hover a cell for the EMA values and the RSI to two decimals.
Settings and limitations
Fast EMA, Slow EMA and RSI length apply to every row; Overbought and Oversold set the RSI zones. The 1 hour, 1 day and 1 week rows can be switched off (their bars then do not load). The table position and the three colours are appearance settings.
Notes
Formulas: EMA with alpha 2 / (length + 1), started at the first close of each series; RSI (StockCharts ChartSchool, Relative Strength Index; Wilder): average gain and loss start as the simple average of the first length changes, then (previous x (length - 1) + current) / length, RSI = 100 - 100 / (1 + gain / loss). The higher timeframes use regular-hours bars (1 month hourly, 2 years daily, 5 years weekly) and only their completed bars: a bar counts once the chart's last bar ends at or after its end. An hourly bar ends at the next clock hour (the first regular-hours bar, 09:30, is a half hour and ends at 10:00), a daily bar at the regular close (16:00, or 13:00 on NYSE early-close days), a weekly bar when its week is over (so the weekly row turns over on Monday). The chart's last bar ends at its time plus its length on intraday charts (on the clock grid, so an hourly chart's 09:30 bar ends at 10:00) and with its day, week or month on daily, weekly and monthly charts. The period still forming is left out, so those rows change when it ends. The table updates at every close of a chart bar (live: none), the chart row from completed chart bars: a table that updated on every tick would have to hold its bar-close values anyway while the kept-up-to-date hourly, daily and weekly bars form (W-LIVE-HELD), so it reads completed bars everywhere. Values depend a little on where each series starts, because the EMAs start at the first close.
Settings
Each setting appears in the indicator's settings panel in Spectral, next to a color setting for every output.
| Setting | Type | Default | Range or options | What it does |
|---|---|---|---|---|
| Fast EMA | Whole number | 20 | 2 – 200 | Bars in the fast EMA of the close, on every timeframe. |
| Slow EMA | Whole number | 50 | 3 – 400 | Bars in the slow EMA of the close, on every timeframe. |
| RSI length | Whole number | 14 | 2 – 100 | Bars in Wilder's RSI, on every timeframe. |
| Overbought | Number | 70 | 50 – 100, step 1 | RSI at or above this level reads overbought. |
| Oversold | Number | 30 | 0 – 50, step 1 | RSI at or below this level reads oversold. |
| 1 hour row | On / off | On | — | Show the hourly row (loads hourly bars). |
| 1 day row | On / off | On | — | Show the daily row (loads daily bars). |
| 1 week row | On / off | On | — | Show the weekly row (loads weekly bars). |
What it draws
Tables
- Trend dashboard4 columns · top right · cell borders
#161B22
Source
Save it as mtf-trend-dashboard.js and add it with Indicators → Custom indicators → Add file…. The format is explained in the custom indicators guide.
// Copyright (c) 2026 Spectral
// SPDX-License-Identifier: MIT-0
// Free to use, copy, modify and share: https://spectral.trade/docs/custom-indicators/LICENSE.txt
/** @type {import('./spectral-indicator').IndicatorV3} */
export default {
  schemaVersion: 3,
  id: 'mtf-trend-dashboard',
  name: 'Multi-Timeframe Trend Dashboard',
  shortName: 'MTF Trend',
  version: '1.0.0',
  author: 'Spectral',
  description: 'A table with the EMA 20/50 trend and the RSI 14 of the chart\'s bars and of hourly, daily and weekly bars, each cell coloured by its state.',
  pane: 'price',
  live: 'none',
  inputs: {
    fast: { type: 'integer', label: 'Fast EMA', default: 20, min: 2, max: 200, description: 'Bars in the fast EMA of the close, on every timeframe.' },
    slow: { type: 'integer', label: 'Slow EMA', default: 50, min: 3, max: 400, description: 'Bars in the slow EMA of the close, on every timeframe.' },
    rsiLength: { type: 'integer', label: 'RSI length', default: 14, min: 2, max: 100, description: 'Bars in Wilder\'s RSI, on every timeframe.' },
    overbought: { type: 'number', label: 'Overbought', default: 70, min: 50, max: 100, step: 1, description: 'RSI at or above this level reads overbought.' },
    oversold: { type: 'number', label: 'Oversold', default: 30, min: 0, max: 50, step: 1, description: 'RSI at or below this level reads oversold.' },
    showHourly: { type: 'boolean', label: '1 hour row', default: true, description: 'Show the hourly row (loads hourly bars).' },
    showDaily: { type: 'boolean', label: '1 day row', default: true, description: 'Show the daily row (loads daily bars).' },
    showWeekly: { type: 'boolean', label: '1 week row', default: true, description: 'Show the weekly row (loads weekly bars).' },
  },
  auxiliary: {
    hourly: { barSize: '1 hour', duration: '1 M', useRth: true, keepUpToDate: true, when: { all: ['showHourly'] } },
    daily: { barSize: '1 day', duration: '2 Y', useRth: true, keepUpToDate: true, when: { all: ['showDaily'] } },
    weekly: { barSize: '1 week', duration: '5 Y', useRth: true, keepUpToDate: true, when: { all: ['showWeekly'] } },
  },
  palettes: {
    state: { label: 'State', colors: ['#2EA043', '#DA3633', '#6E7681'] },
  },
  tables: {
    trend: { label: 'Trend dashboard', position: 'top-right', columns: [{ align: 'left' }, { align: 'center', width: 6 }, { align: 'right', width: 5 }, { align: 'center', width: 10 }], border: true },
  },
  docs: {
    overview: 'One table for the trend on four timeframes: the chart\'s own bars and hourly, daily and weekly bars of the same symbol. For each it shows whether the EMA 20 of the close is above or below the EMA 50, the 14-bar RSI (J. Welles Wilder, 1978) and whether that RSI is overbought or oversold.',
    howToRead: 'Up (green): the fast EMA is above the slow one; Down (red): below. The RSI cell is green above 50 and red below. Overbought means the RSI is at or above 70, oversold at or below 30 (Wilder\'s levels). Timeframes that agree describe a strong trend; a lower timeframe against a higher one is often a pullback. Hover a cell for the EMA values and the RSI to two decimals.',
    settings: 'Fast EMA, Slow EMA and RSI length apply to every row; Overbought and Oversold set the RSI zones. The 1 hour, 1 day and 1 week rows can be switched off (their bars then do not load). The table position and the three colours are appearance settings.',
    notes: 'Formulas: EMA with alpha 2 / (length + 1), started at the first close of each series; RSI (StockCharts ChartSchool, Relative Strength Index; Wilder): average gain and loss start as the simple average of the first length changes, then (previous x (length - 1) + current) / length, RSI = 100 - 100 / (1 + gain / loss). The higher timeframes use regular-hours bars (1 month hourly, 2 years daily, 5 years weekly) and only their completed bars: a bar counts once the chart\'s last bar ends at or after its end. An hourly bar ends at the next clock hour (the first regular-hours bar, 09:30, is a half hour and ends at 10:00), a daily bar at the regular close (16:00, or 13:00 on NYSE early-close days), a weekly bar when its week is over (so the weekly row turns over on Monday). The chart\'s last bar ends at its time plus its length on intraday charts (on the clock grid, so an hourly chart\'s 09:30 bar ends at 10:00) and with its day, week or month on daily, weekly and monthly charts. The period still forming is left out, so those rows change when it ends. The table updates at every close of a chart bar (live: none), the chart row from completed chart bars: a table that updated on every tick would have to hold its bar-close values anyway while the kept-up-to-date hourly, daily and weekly bars form (W-LIVE-HELD), so it reads completed bars everywhere. Values depend a little on where each series starts, because the EMAs start at the first close.',
  },
  calculate(ctx) {
    const { bars, auxiliary, inputs, ta, time, format } = ctx;
    if (bars.length === 0) return { tables: { trend: null } };
    const latest = bars[bars.length - 1];
    const at = (seconds) => ({ ...latest, time: seconds });
    // New York midnights that start the next week and the next month after a bar's (noon probes stay on the right
    // date across a daylight-saving change).
    const nextWeek = (bar) => time.weekStart(at(time.weekStart(bar) + 7 * 86400 + 12 * 3600));
    const nextMonth = (bar) => {
      const probe = time.dayStart(bar) + (33 - Number(time.ny(bar).dateKey.slice(8))) * 86400 + 12 * 3600;
      return time.dayStart(at(probe - (Number(time.ny(at(probe)).dateKey.slice(8)) - 1) * 86400));
    };
    // Where the chart's last bar ends. Intraday bars that divide an hour sit on the clock grid, so the 09:30 bar of
    // an hourly chart (a half hour) ends at 10:00; daily, weekly and monthly bars end with their day, week or month.
    const [count, unit = ''] = ctx.barSize.split(' ');
    const step = Number(count) * ({ secs: 1, min: 60, mins: 60, hour: 3600, hours: 3600 }[unit] ?? 0);
    const latestEnd = step > 0 ? (3600 % step === 0 ? (Math.floor(latest.time / step) + 1) * step : latest.time + step)
      : unit.startsWith('week') ? nextWeek(latest)
        : unit.startsWith('month') ? nextMonth(latest)
          : time.dayStart(at(time.dayStart(latest) + 36 * 3600));
    // Where a higher-timeframe bar ends: an hourly bar at the next clock hour (the 09:30 bar is a half hour, the
    // first bar of the regular session), a daily bar at the regular close (16:00, 13:00 on early-close days), a
    // weekly bar when its week is over. It is complete once the chart's last bar ends at or after that.
    const dayClose = (bar) => {
      const midnight = time.dayStart(bar);
      return midnight + (time.isRegularSession(at(midnight + 15 * 3600)) ? 16 : 13) * 3600;
    };
    const completed = {
      hourly: (bar) => latestEnd >= (Math.floor(bar.time / 3600) + 1) * 3600,
      daily: (bar) => latestEnd >= dayClose(bar),
      weekly: (bar) => latestEnd >= nextWeek(bar),
    };
    const rowOf = (name, series) => {
      if (series.length === 0) return [name, 'n/a', 'n/a', 'n/a'];
      const close = ta.source(series, 'close');
      const last = series.length - 1;
      const fast = ta.ema(close, inputs.fast)[last];
      const slow = ta.ema(close, inputs.slow)[last];
      const rsi = ta.rsi(close, inputs.rsiLength)[last];
      const trend = fast > slow ? { text: 'Up', palette: 0 } : fast < slow ? { text: 'Down', palette: 1 } : { text: 'Flat', palette: 2 };
      const tooltip = `EMA ${inputs.fast} ${format.price(fast)} / EMA ${inputs.slow} ${format.price(slow)}`;
      if (rsi === null) return [name, { ...trend, tooltip }, 'n/a', 'n/a'];
      const zone = rsi >= inputs.overbought ? { text: 'Overbought', palette: 1 }
        : rsi <= inputs.oversold ? { text: 'Oversold', palette: 0 } : { text: 'Neutral', palette: 2 };
      return [
        name,
        { ...trend, tooltip },
        { text: format.number(rsi, 1), palette: rsi > 50 ? 0 : rsi < 50 ? 1 : 2, tooltip: `RSI ${inputs.rsiLength} ${format.number(rsi, 2)}` },
        zone,
      ];
    };
    const rows = [['TF', `EMA ${inputs.fast}/${inputs.slow}`, `RSI ${inputs.rsiLength}`, 'Zone'], rowOf('Chart', bars)];
    const higher = [['1 hour', 'hourly', inputs.showHourly], ['1 day', 'daily', inputs.showDaily], ['1 week', 'weekly', inputs.showWeekly]];
    for (const [name, alias, shown] of higher) {
      if (!shown) continue;
      const series = auxiliary[alias];
      const last = series.length - 1;
      rows.push(rowOf(name, last >= 0 && !completed[alias](series[last]) ? series.slice(0, last) : series));
    }
    return { tables: { trend: { palette: 'state', rows } } };
  },
};
Adapt it with an LLM
Paste this into your assistant and replace the second-to-last line with the change you want.
Start from this Spectral custom indicator: https://spectral.trade/indicators/mtf-trend-dashboard.js
Format reference: https://spectral.trade/docs/custom-indicators.llm.md
Keep the file format and every rule of the reference; give the result a new id, name, shortName and version, and update docs and input descriptions to match.
Keep its live updates exact and fast (section "Fast live updates" of the reference): carry values from bar to bar only through ctx.ta, and raise live.lookback if the change reads further back; Spectral rejects a file whose live updates differ from a full recalculation or are too slow.
Change I want: <describe the change>
Answer with the complete file in one code block, ready to save as <id>.js.
Related indicators
EMA Ribbon Ribbon
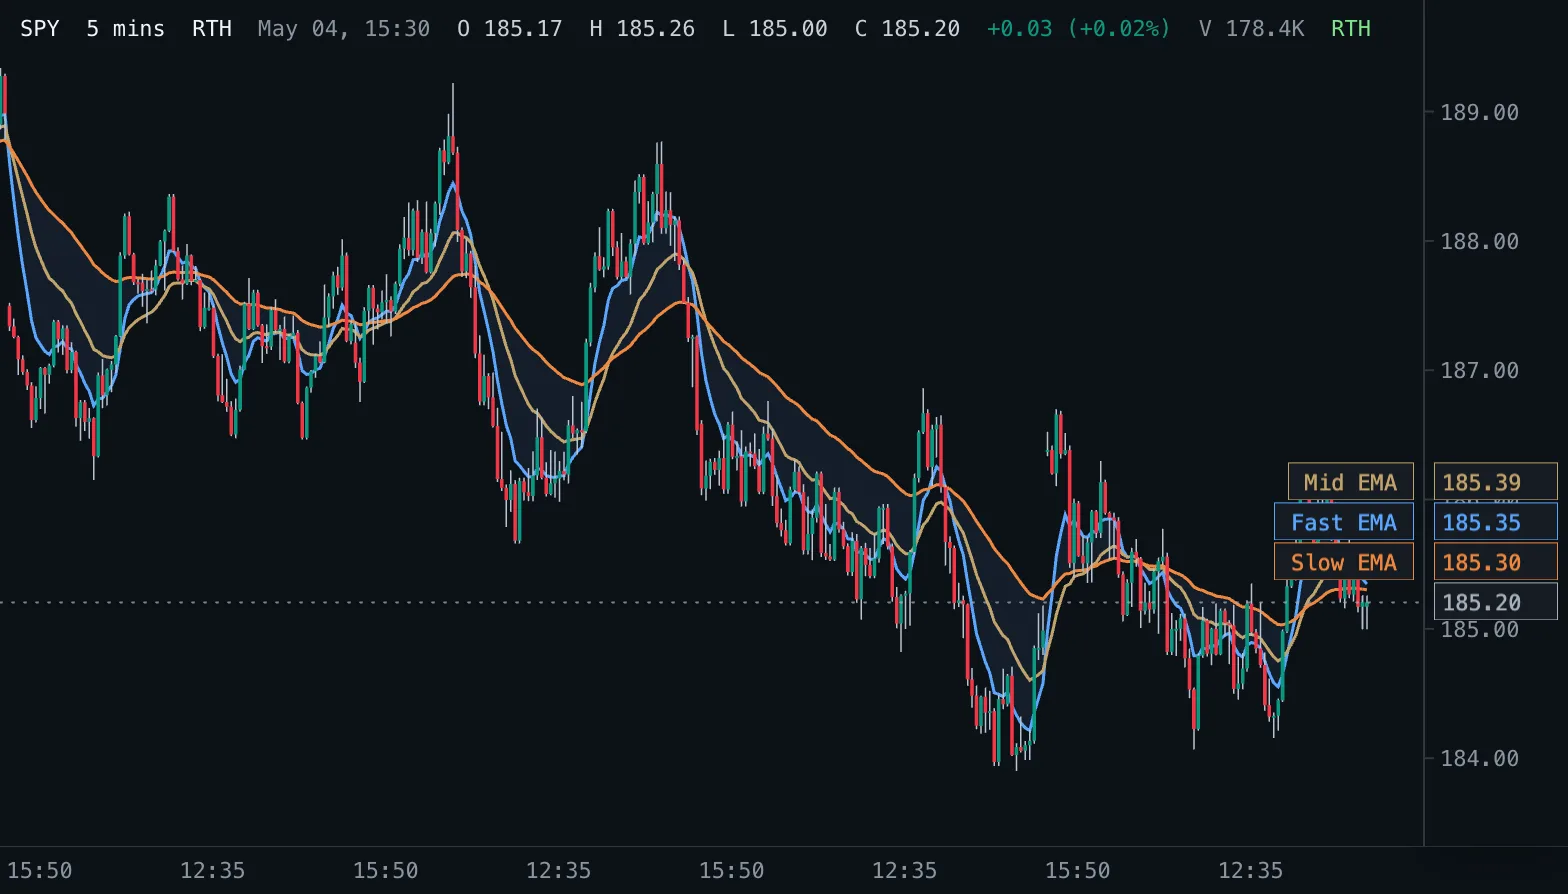
Three exponential moving averages on the price pane with a shaded band between the fastest and the slowest.
Exponential Moving Average EMA
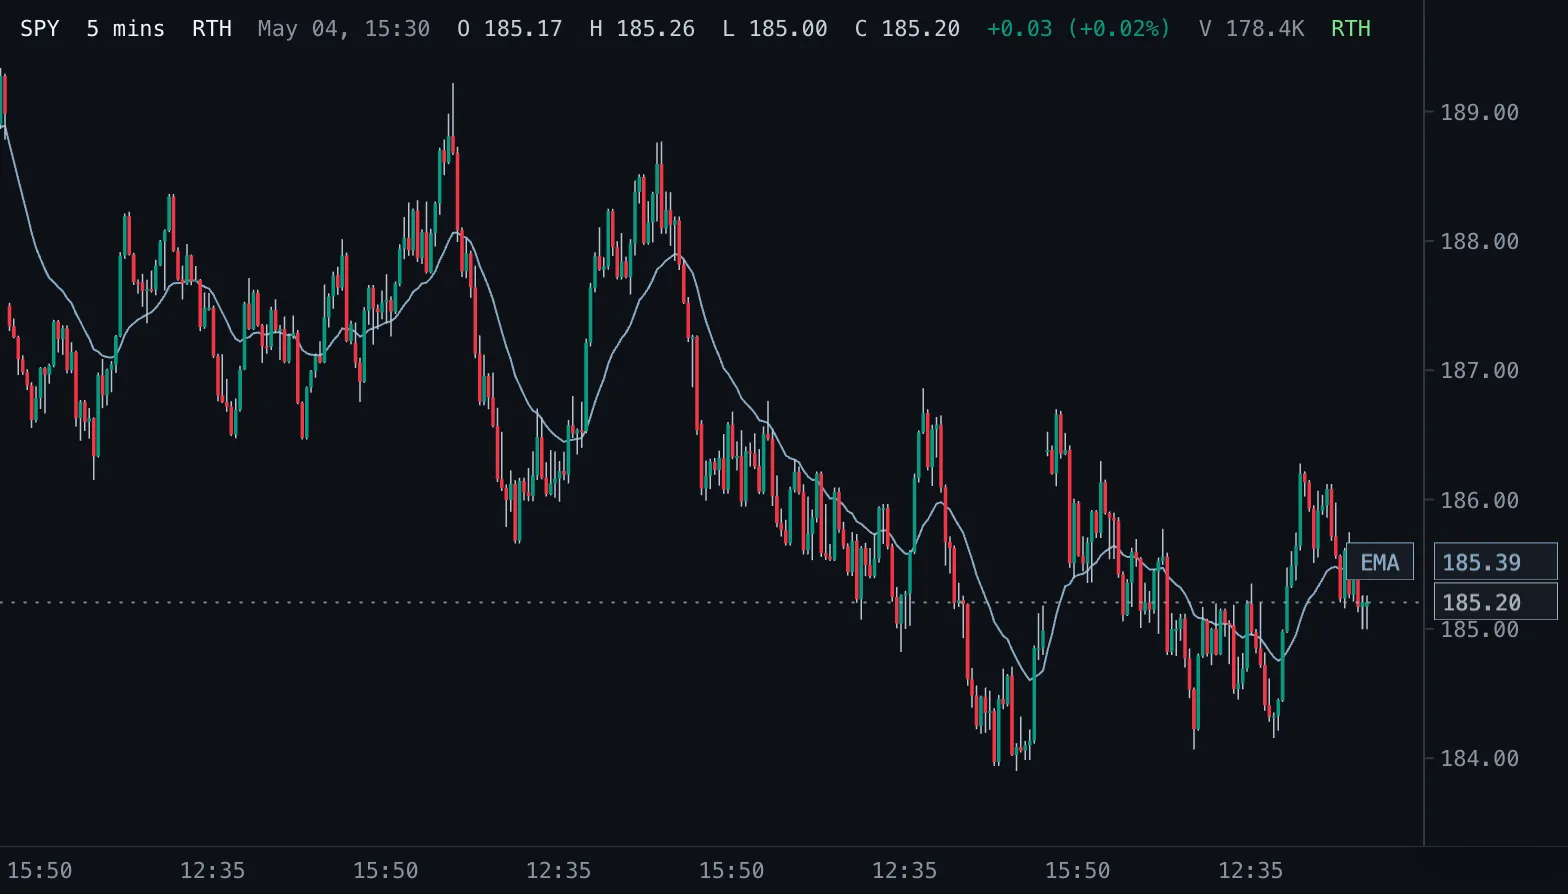
Exponential moving average of the chosen price, weighting recent bars more, drawn on the candles.
Ichimoku Cloud Ichimoku
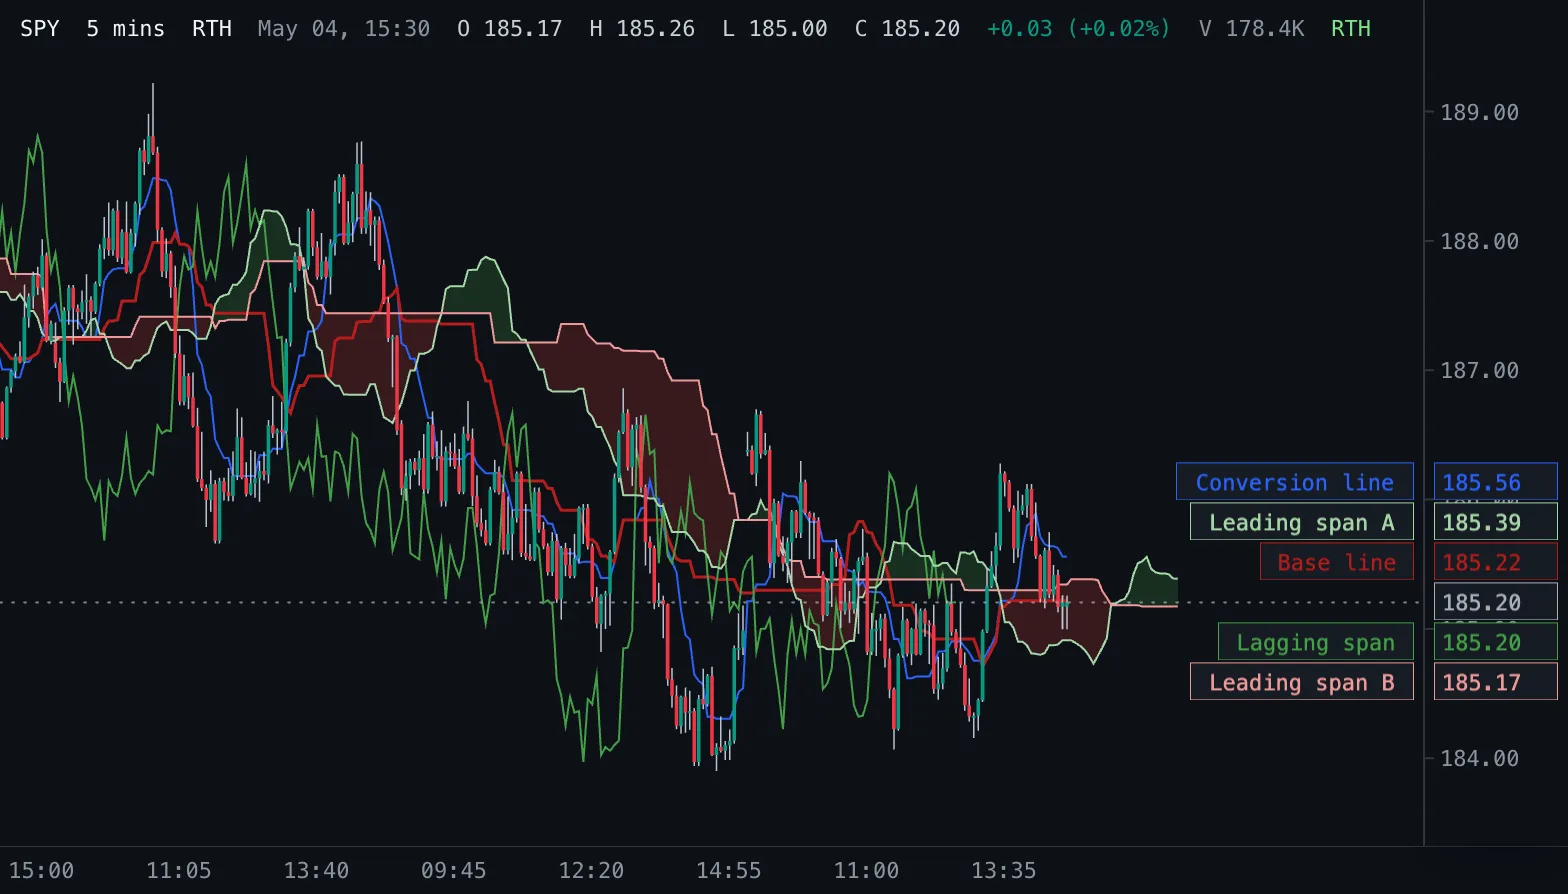
Ichimoku Kinko Hyo: conversion and base lines, a cloud of two leading spans projected into the future, and the lagging close.