Bollinger BandWidth
The width of the Bollinger Bands as a percentage of the basis, with its highest and lowest value over a longer lookback to spot squeezes.
- BBW
- Built into Spectral
- Updates every tick
- bollinger bands
- bandwidth
- squeeze
- volatility
- contraction
- expansion
MIT-0: free to use, change and share, no attribution needed. What you build from it is yours.
Already in Spectral: add it from the Indicators toolbox. The file here is the same indicator written as a custom indicator, to change or learn from. Installed, it appears next to the built-in one, marked Custom.
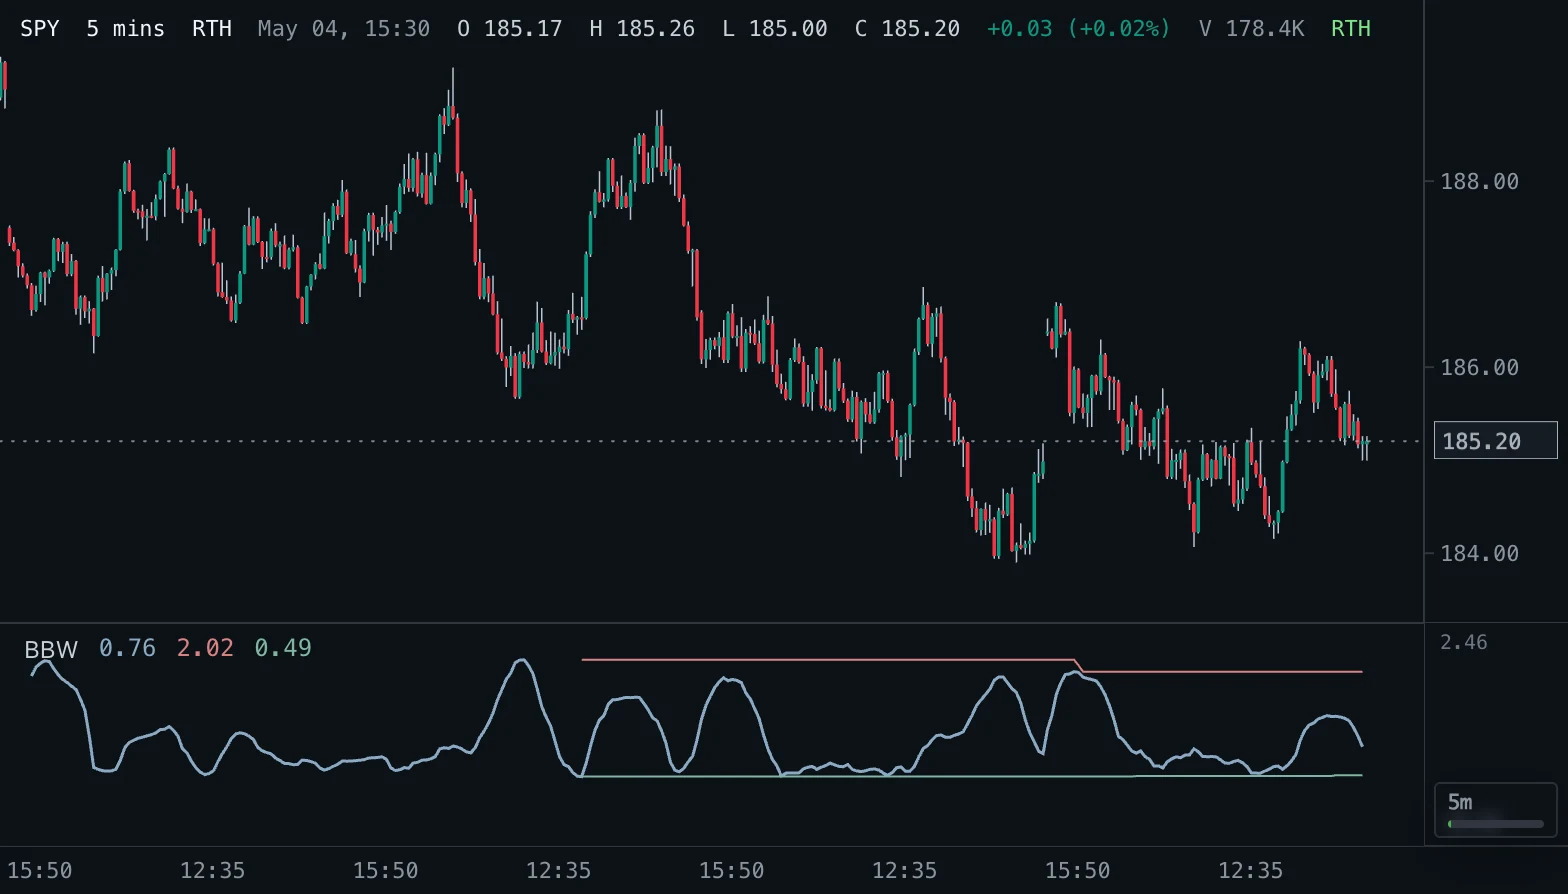
Overview
Bollinger BandWidth measures how wide the Bollinger Bands are relative to their basis: (upper band minus lower band) divided by the basis, times 100. A reading of 4 means the bands are 4 percent of price apart.
Two extra lines track the highest and the lowest BandWidth over a longer lookback (125 bars by default), so you can see at a glance when volatility is at an extreme for the period.
How to read it
Low BandWidth means a quiet, compressed market; high BandWidth an expanded, volatile one. Volatility alternates between the two, so a reading at or near the lowest contraction line is the Bollinger squeeze: a sign that a larger move may be coming, though not in which direction.
A new highest expansion usually comes with a strong move already under way; when BandWidth turns down from such a high, the move often starts to lose momentum or turn into a range.
Settings and limitations
Length, Basis average, Source and Standard deviations define the bands exactly as in Bollinger Bands; 20 bars and 2 standard deviations are the standard. Highest expansion length and Lowest contraction length set the lookback of the two reference lines; Bollinger uses about six months of daily bars (125) for the squeeze.
BandWidth appears after Length bars; each reference line needs its own lookback of BandWidth values on top of that. Because the value is a percentage of price, it can be compared across symbols.
Notes
Matches TradingView's Bollinger BandWidth, including the scale (times 100) and the highest expansion and lowest contraction lines. Some platforms show the same ratio without the factor of 100. Uses the population standard deviation, like the Bollinger Bands built-in.
Settings
Each setting appears in the indicator's settings panel in Spectral, next to a color setting for every output.
| Setting | Type | Default | Range or options | What it does |
|---|---|---|---|---|
| Length | Whole number | 20 | 2 – 500 | Bars in the moving average and in the standard deviation of the bands. |
| Basis average | Choice | SMA | SMA, EMA, SMMA (RMA), WMA | Moving average used for the middle of the bands. Bollinger's definition uses the simple moving average (SMA). |
| Source | Price source | close | open, high, low, close, hlc3 | Price the bands are computed from. |
| Standard deviations | Number | 2 | 0.1 – 10, step 0.1 | Distance of each band from the basis, in standard deviations of the source over Length bars. |
| Highest expansion length | Whole number | 125 | 1 – 500 | Bars over which the highest BandWidth is tracked. A new high marks a volatility expansion. |
| Lowest contraction length | Whole number | 125 | 1 – 500 | Bars over which the lowest BandWidth is tracked. A new low marks a squeeze. |
What it draws
Lines
- BandWidthsolid · 1.5 px · primary
#8AA9C3 - Highest expansionsolid · 1 px
#D98282 - Lowest contractionsolid · 1 px
#7FB5A0
Source
Save it as bollinger-bandwidth.js and add it with Indicators → Custom indicators → Add file…. The format is explained in the custom indicators guide.
// Copyright (c) 2026 Spectral
// SPDX-License-Identifier: MIT-0
// Free to use, copy, modify and share: https://spectral.trade/docs/custom-indicators/LICENSE.txt
/** @type {import('./spectral-indicator').IndicatorV2} */
export default {
  schemaVersion: 2,
  id: 'bollinger-bandwidth',
  name: 'Bollinger BandWidth',
  shortName: 'BBW',
  version: '1.0.0',
  author: 'Spectral',
  description: 'The width of the Bollinger Bands as a percentage of the basis, with its highest and lowest value over a longer lookback to spot squeezes.',
  pane: 'oscillator',
  live: { lookback: 'length + expansionLength + contractionLength' },
  inputs: {
    length: { type: 'integer', label: 'Length', default: 20, min: 2, max: 500, description: 'Bars in the moving average and in the standard deviation of the bands.' },
    maType: { type: 'select', label: 'Basis average', default: 'SMA', options: ['SMA', 'EMA', 'SMMA (RMA)', 'WMA'], description: 'Moving average used for the middle of the bands. Bollinger\'s definition uses the simple moving average (SMA).' },
    source: { type: 'source', label: 'Source', default: 'close', description: 'Price the bands are computed from.' },
    mult: { type: 'number', label: 'Standard deviations', default: 2, min: 0.1, max: 10, step: 0.1, description: 'Distance of each band from the basis, in standard deviations of the source over Length bars.' },
    expansionLength: { type: 'integer', label: 'Highest expansion length', default: 125, min: 1, max: 500, description: 'Bars over which the highest BandWidth is tracked. A new high marks a volatility expansion.' },
    contractionLength: { type: 'integer', label: 'Lowest contraction length', default: 125, min: 1, max: 500, description: 'Bars over which the lowest BandWidth is tracked. A new low marks a squeeze.' },
  },
  plots: {
    bandwidth: { label: 'BandWidth', color: '#8AA9C3', lineWidth: 1.5, primary: true },
    expansion: { label: 'Highest expansion', color: '#D98282', lineWidth: 1 },
    contraction: { label: 'Lowest contraction', color: '#7FB5A0', lineWidth: 1 },
  },
  docs: {
    overview: 'Bollinger BandWidth measures how wide the Bollinger Bands are relative to their basis: (upper band minus lower band) divided by the basis, times 100. A reading of 4 means the bands are 4 percent of price apart.\n\nTwo extra lines track the highest and the lowest BandWidth over a longer lookback (125 bars by default), so you can see at a glance when volatility is at an extreme for the period.',
    howToRead: 'Low BandWidth means a quiet, compressed market; high BandWidth an expanded, volatile one. Volatility alternates between the two, so a reading at or near the lowest contraction line is the Bollinger squeeze: a sign that a larger move may be coming, though not in which direction.\n\nA new highest expansion usually comes with a strong move already under way; when BandWidth turns down from such a high, the move often starts to lose momentum or turn into a range.',
    settings: 'Length, Basis average, Source and Standard deviations define the bands exactly as in Bollinger Bands; 20 bars and 2 standard deviations are the standard. Highest expansion length and Lowest contraction length set the lookback of the two reference lines; Bollinger uses about six months of daily bars (125) for the squeeze.\n\nBandWidth appears after Length bars; each reference line needs its own lookback of BandWidth values on top of that. Because the value is a percentage of price, it can be compared across symbols.',
    notes: 'Matches TradingView\'s Bollinger BandWidth, including the scale (times 100) and the highest expansion and lowest contraction lines. Some platforms show the same ratio without the factor of 100. Uses the population standard deviation, like the Bollinger Bands built-in.',
  },
  calculate(ctx) {
    const { bars, inputs, ta } = ctx;
    const source = ta.source(bars, inputs.source);
    const basis = movingAverage(ta, source, inputs.maType, inputs.length);
    const deviation = ta.stdev(source, inputs.length);
    const bandwidth = basis.map((value, index) => {
      if (value === null || deviation[index] === null || value === 0) return null;
      const width = 2 * inputs.mult * deviation[index];
      // A flat window's deviation is rounding noise, not zero, for most prices.
      return width > 1e-10 * Math.abs(value) ? (width / value) * 100 : 0;
    });
    return {
      plots: {
        bandwidth,
        expansion: ta.highest(bandwidth, inputs.expansionLength),
        contraction: ta.lowest(bandwidth, inputs.contractionLength),
      },
    };
  },
};

function movingAverage(ta, values, type, length) {
  if (type === 'EMA') return ta.ema(values, length);
  if (type === 'SMMA (RMA)') return ta.rma(values, length);
  if (type === 'WMA') return ta.wma(values, length);
  return ta.sma(values, length);
}
Adapt it with an LLM
Paste this into your assistant and replace the second-to-last line with the change you want.
Start from this Spectral custom indicator: https://spectral.trade/indicators/bollinger-bandwidth.js
Format reference: https://spectral.trade/docs/custom-indicators.llm.md
Keep the file format and every rule of the reference; give the result a new id, name, shortName and version, and update docs and input descriptions to match.
Keep its live updates exact and fast (section "Fast live updates" of the reference): carry values from bar to bar only through ctx.ta, and raise live.lookback if the change reads further back; Spectral rejects a file whose live updates differ from a full recalculation or are too slow.
Change I want: <describe the change>
Answer with the complete file in one code block, ready to save as <id>.js.
Related indicators
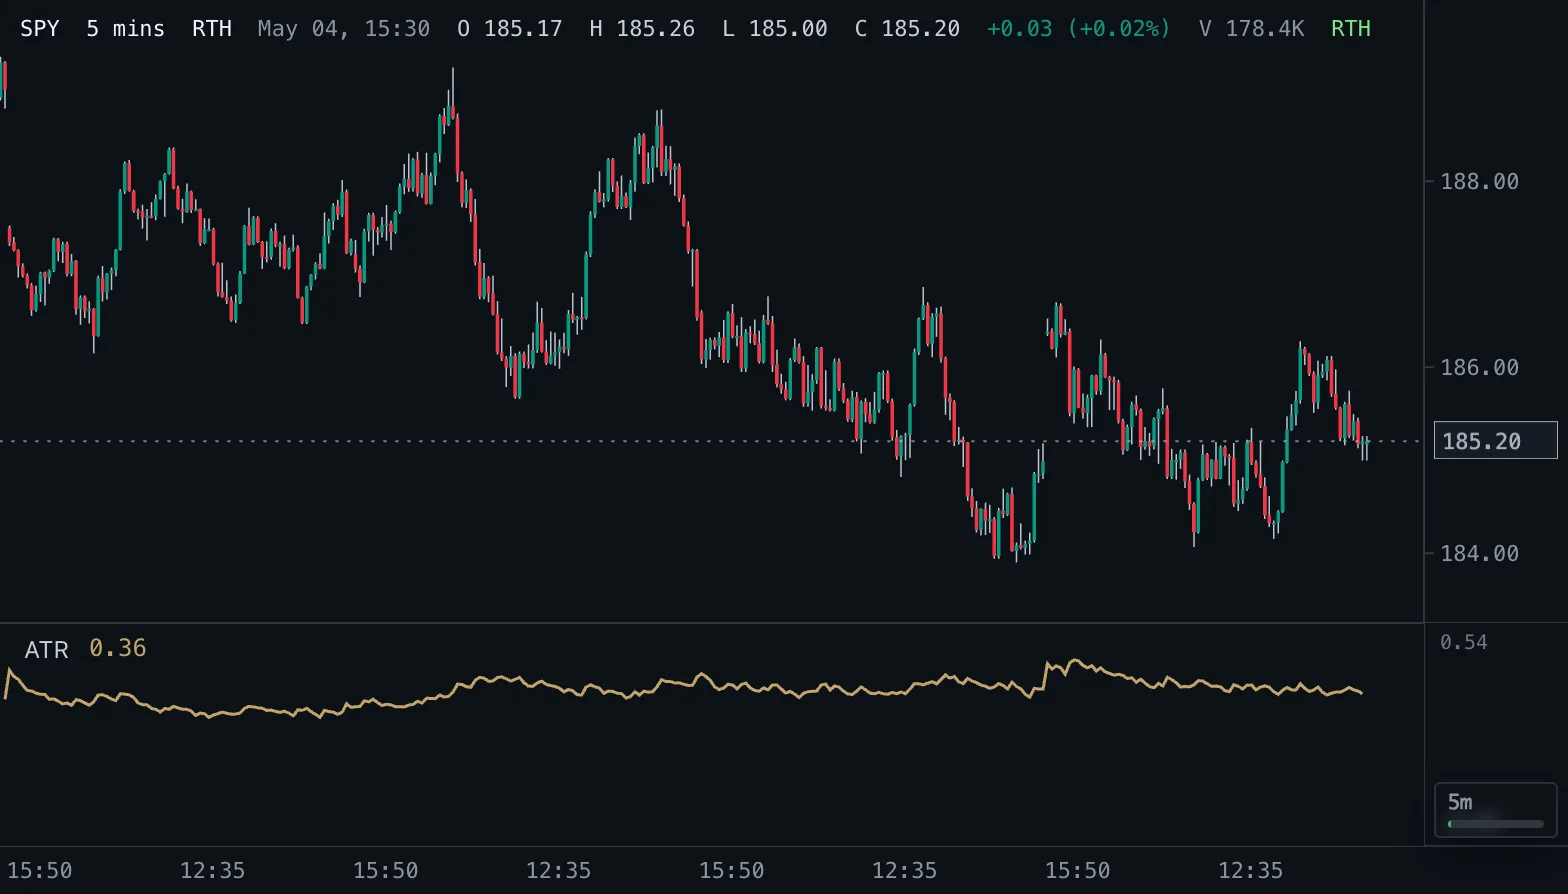
Average True Range ATR
Average True Range: the average size of a bar including gaps, in price units, with Wilder smoothing by default.
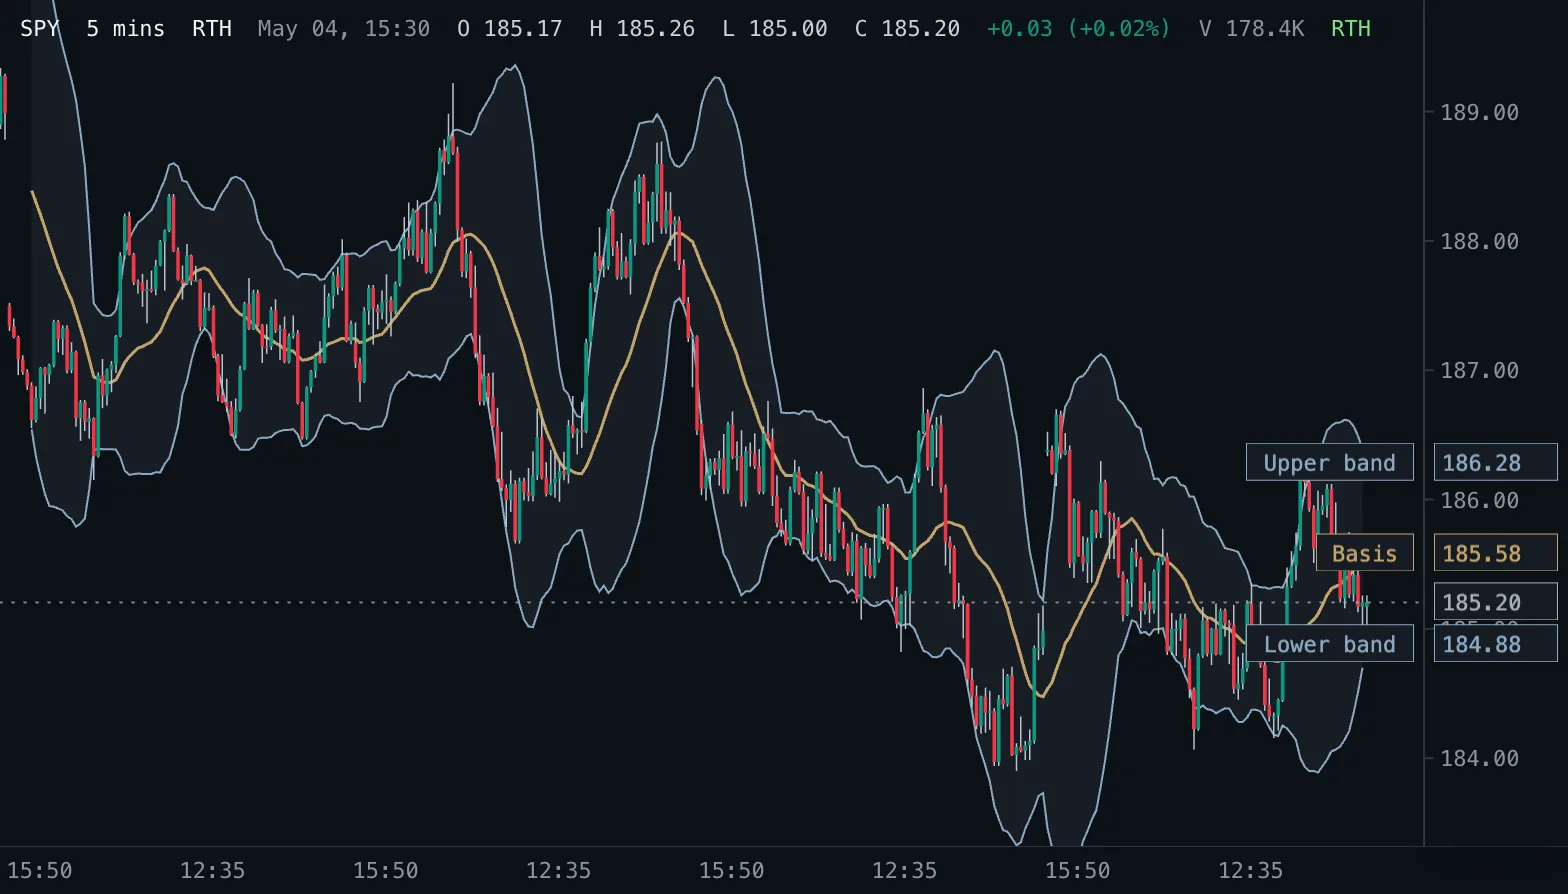
Bollinger Bands BB
A moving average with bands a chosen number of standard deviations above and below it, so the band width follows volatility.
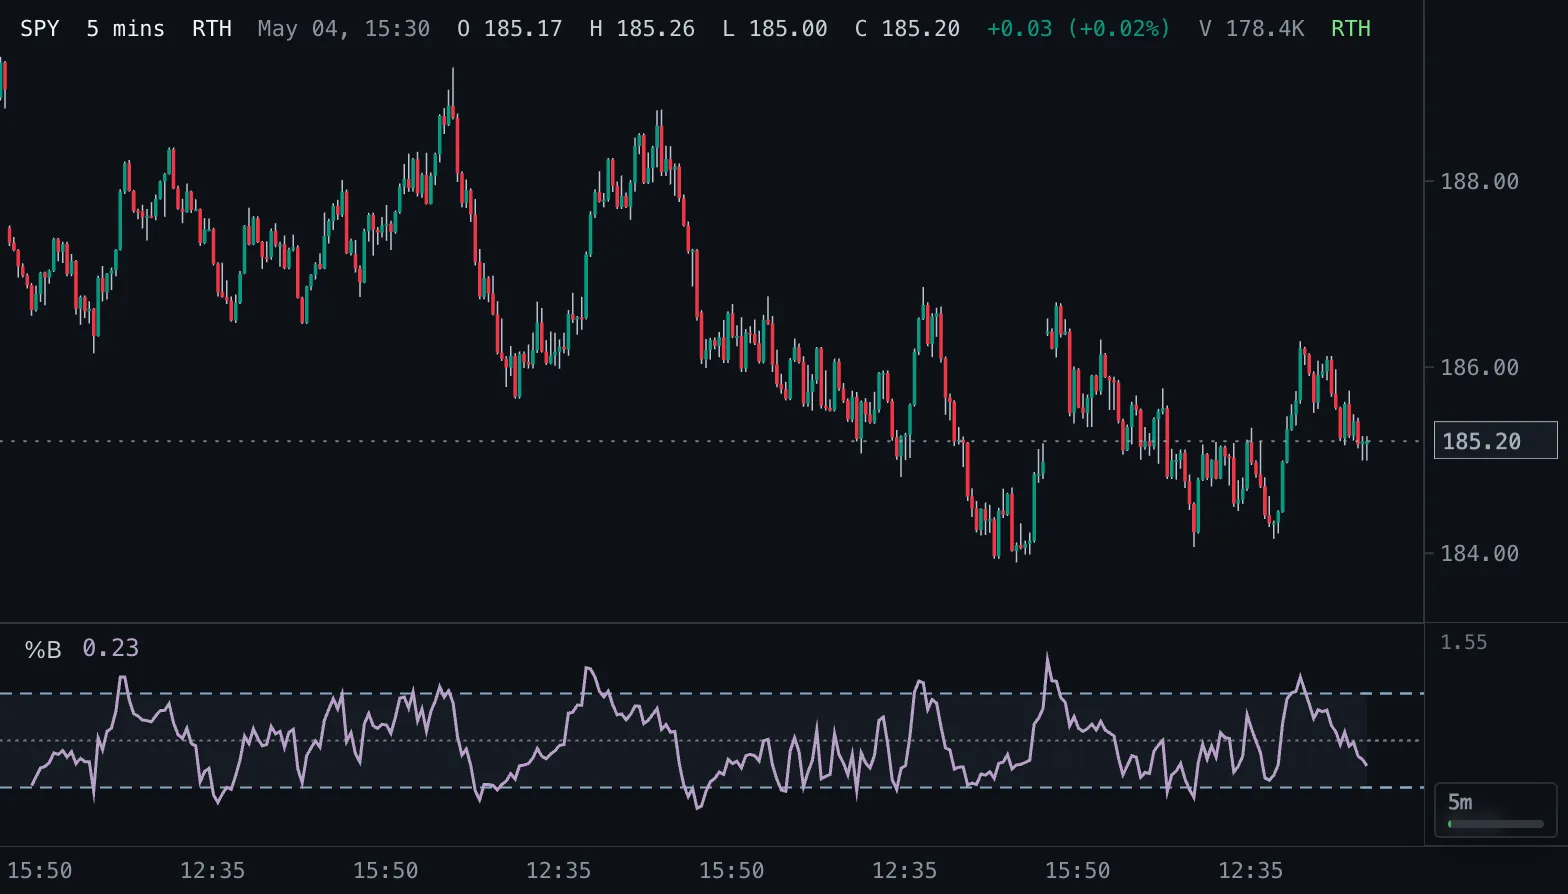
Bollinger %B %B
Where price sits within its Bollinger Bands: 1 at the upper band, 0.5 at the basis, 0 at the lower band.