Average True Range
Average True Range: the average size of a bar including gaps, in price units, with Wilder smoothing by default.
- ATR
- Built into Spectral
- Updates every tick
- atr
- average true range
- true range
- wilder
- volatility
- stop loss
- position sizing
MIT-0: free to use, change and share, no attribution needed. What you build from it is yours.
Already in Spectral: add it from the Indicators toolbox. The file here is the same indicator written as a custom indicator, to change or learn from. Installed, it appears next to the built-in one, marked Custom.
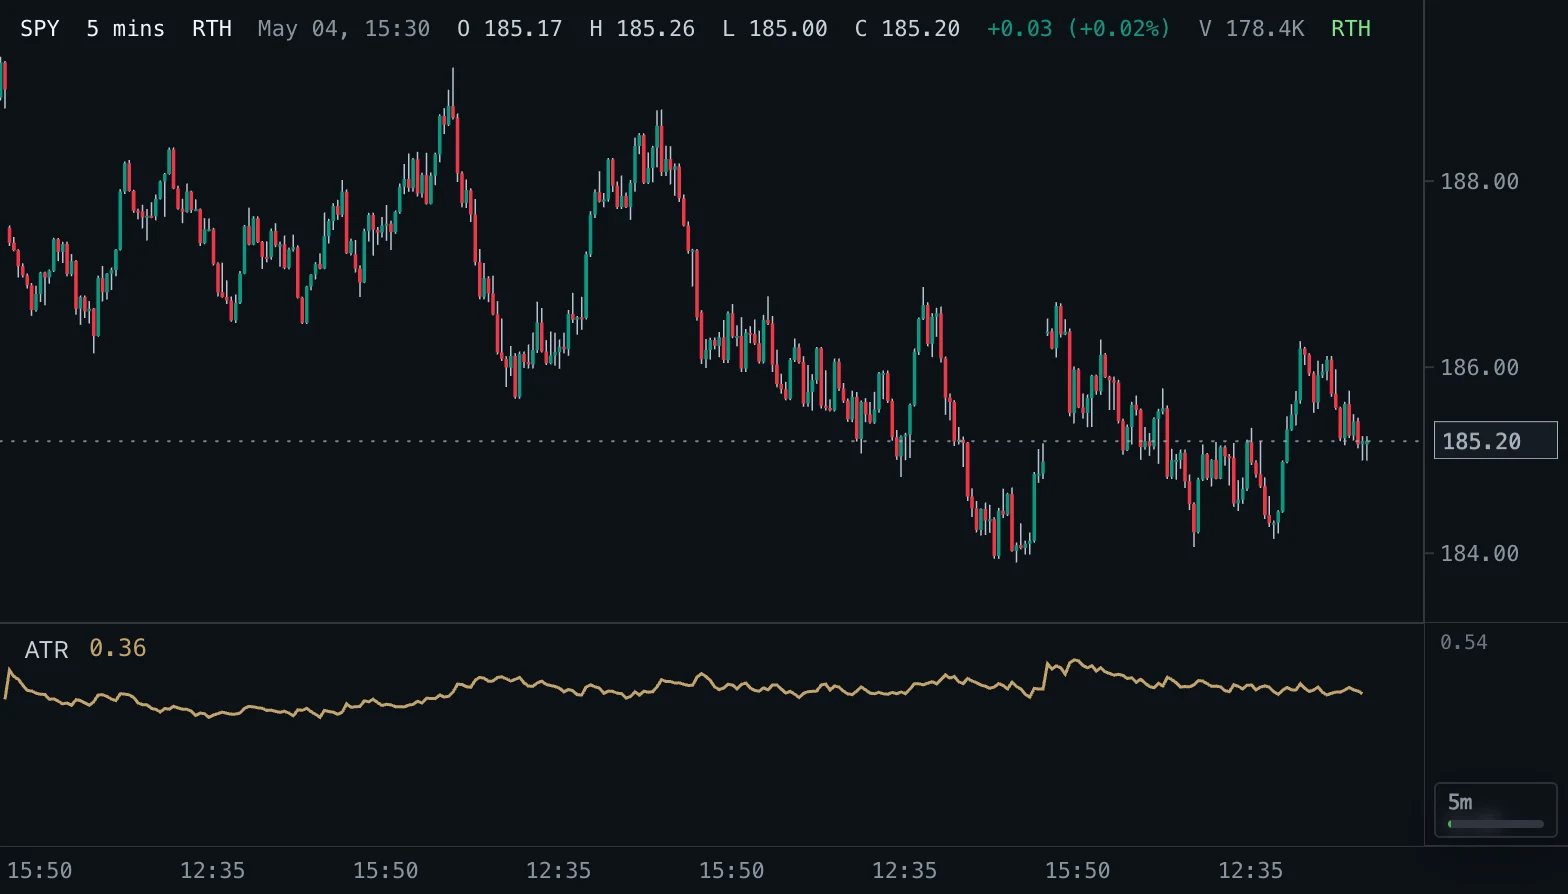
Overview
The Average True Range (ATR), introduced by J. Welles Wilder, measures how much a market moves per bar. The true range of a bar is the largest of: its high minus its low, the distance from the previous close up to the high, and the distance from the previous close down to the low, so overnight gaps count as movement. ATR is the average of the true ranges over the last Length bars.
ATR is in price units: an ATR of 1.20 on a stock means a typical bar covers about 1.20 dollars.
How to read it
Rising ATR means bars are getting larger and the market more volatile; falling ATR means it is calming down. ATR says nothing about direction: a sharp sell-off and a strong rally both raise it.
Traders use it to size stops and targets (for example a stop 1.5 or 2 ATR from entry), to size positions so each trade risks a similar amount of volatility, and to judge whether a move is large for this market. Because it is in price units, compare ATR across symbols as a percentage of price, not as a raw number.
Settings and limitations
Length sets how many bars are averaged; 14 is the standard, shorter values react faster to a change in volatility. Smoothing chooses the average: RMA (Wilder's smoothing) is the classic definition; SMA weighs every bar in the window equally; EMA and WMA react faster than RMA.
The first value appears after Length bars. The first bar of the chart has no previous close, so its true range is its high minus its low.
Notes
With RMA smoothing this is Wilder's ATR and matches TradingView's Average True Range and Spectral's ATR used by other indicators. Wilder's smoothing starts with the simple average of the first Length true ranges; the exponential average starts at the first true range and is shown from bar Length onwards, so very early EMA values can differ slightly from platforms that start it with a simple average.
Settings
Each setting appears in the indicator's settings panel in Spectral, next to a color setting for every output.
| Setting | Type | Default | Range or options | What it does |
|---|---|---|---|---|
| Length | Whole number | 14 | 1 – 500 | Bars averaged. 14 is Wilder's original setting. |
| Smoothing | Choice | RMA | RMA, SMA, EMA, WMA | How the true ranges are averaged. RMA is Wilder's smoothing, the standard; SMA, EMA and WMA are simple, exponential and weighted averages. |
Presets
Each preset is its own entry in the Indicators toolbox, with these settings changed.
| Toolbox entry | Short name | Settings |
|---|---|---|
| Average True Range (10) | ATR 10 | Length: 10 |
| Average True Range (20, SMA) | ATR 20 SMA | Length: 20Smoothing: SMA |
What it draws
Lines
- ATRsolid · 1.5 px · primary
#C4A46A
Source
Save it as atr.js and add it with Indicators → Custom indicators → Add file…. The format is explained in the custom indicators guide.
// Copyright (c) 2026 Spectral
// SPDX-License-Identifier: MIT-0
// Free to use, copy, modify and share: https://spectral.trade/docs/custom-indicators/LICENSE.txt
/** @type {import('./spectral-indicator').IndicatorV2} */
export default {
  schemaVersion: 2,
  id: 'atr',
  name: 'Average True Range',
  shortName: 'ATR',
  version: '1.0.0',
  author: 'Spectral',
  description: 'Average True Range: the average size of a bar including gaps, in price units, with Wilder smoothing by default.',
  pane: 'oscillator',
  live: { lookback: 'length' },
  inputs: {
    length: { type: 'integer', label: 'Length', default: 14, min: 1, max: 500, description: 'Bars averaged. 14 is Wilder\'s original setting.' },
    smoothing: { type: 'select', label: 'Smoothing', default: 'RMA', options: ['RMA', 'SMA', 'EMA', 'WMA'], description: 'How the true ranges are averaged. RMA is Wilder\'s smoothing, the standard; SMA, EMA and WMA are simple, exponential and weighted averages.' },
  },
  plots: {
    atr: { label: 'ATR', color: '#C4A46A', lineWidth: 1.5, primary: true },
  },
  presets: [
    { id: 'atr-10', name: 'Average True Range (10)', shortName: 'ATR 10', inputs: { length: 10 } },
    { id: 'atr-20-sma', name: 'Average True Range (20, SMA)', shortName: 'ATR 20 SMA', inputs: { length: 20, smoothing: 'SMA' } },
  ],
  docs: {
    overview: 'The Average True Range (ATR), introduced by J. Welles Wilder, measures how much a market moves per bar. The true range of a bar is the largest of: its high minus its low, the distance from the previous close up to the high, and the distance from the previous close down to the low, so overnight gaps count as movement. ATR is the average of the true ranges over the last Length bars.\n\nATR is in price units: an ATR of 1.20 on a stock means a typical bar covers about 1.20 dollars.',
    howToRead: 'Rising ATR means bars are getting larger and the market more volatile; falling ATR means it is calming down. ATR says nothing about direction: a sharp sell-off and a strong rally both raise it.\n\nTraders use it to size stops and targets (for example a stop 1.5 or 2 ATR from entry), to size positions so each trade risks a similar amount of volatility, and to judge whether a move is large for this market. Because it is in price units, compare ATR across symbols as a percentage of price, not as a raw number.',
    settings: 'Length sets how many bars are averaged; 14 is the standard, shorter values react faster to a change in volatility. Smoothing chooses the average: RMA (Wilder\'s smoothing) is the classic definition; SMA weighs every bar in the window equally; EMA and WMA react faster than RMA.\n\nThe first value appears after Length bars. The first bar of the chart has no previous close, so its true range is its high minus its low.',
    notes: 'With RMA smoothing this is Wilder\'s ATR and matches TradingView\'s Average True Range and Spectral\'s ATR used by other indicators. Wilder\'s smoothing starts with the simple average of the first Length true ranges; the exponential average starts at the first true range and is shown from bar Length onwards, so very early EMA values can differ slightly from platforms that start it with a simple average.',
  },
  calculate(ctx) {
    const { bars, inputs, ta } = ctx;
    const trueRange = ta.trueRange(bars);
    let atr;
    if (inputs.smoothing === 'SMA') atr = ta.sma(trueRange, inputs.length);
    else if (inputs.smoothing === 'EMA') atr = ta.ema(trueRange, inputs.length).map((value, index) => (index < inputs.length - 1 ? null : value));
    else if (inputs.smoothing === 'WMA') atr = ta.wma(trueRange, inputs.length);
    else atr = ta.rma(trueRange, inputs.length);
    return { plots: { atr } };
  },
};
Adapt it with an LLM
Paste this into your assistant and replace the second-to-last line with the change you want.
Start from this Spectral custom indicator: https://spectral.trade/indicators/atr.js
Format reference: https://spectral.trade/docs/custom-indicators.llm.md
Keep the file format and every rule of the reference; give the result a new id, name, shortName and version, and update docs and input descriptions to match.
Keep its live updates exact and fast (section "Fast live updates" of the reference): carry values from bar to bar only through ctx.ta, and raise live.lookback if the change reads further back; Spectral rejects a file whose live updates differ from a full recalculation or are too slow.
Change I want: <describe the change>
Answer with the complete file in one code block, ready to save as <id>.js.
Related indicators
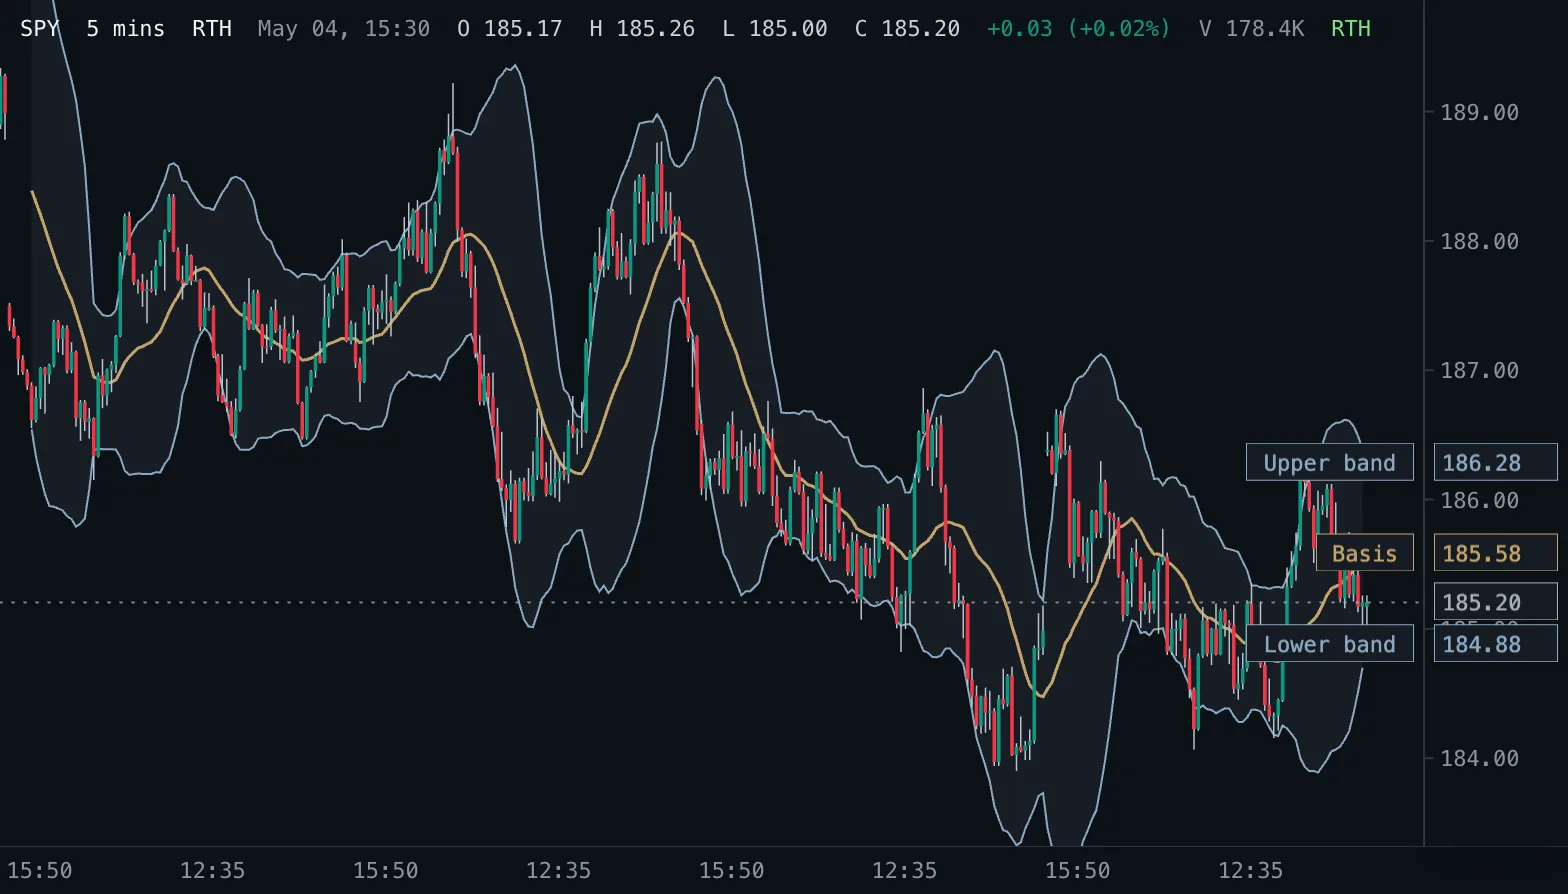
Bollinger Bands BB
A moving average with bands a chosen number of standard deviations above and below it, so the band width follows volatility.
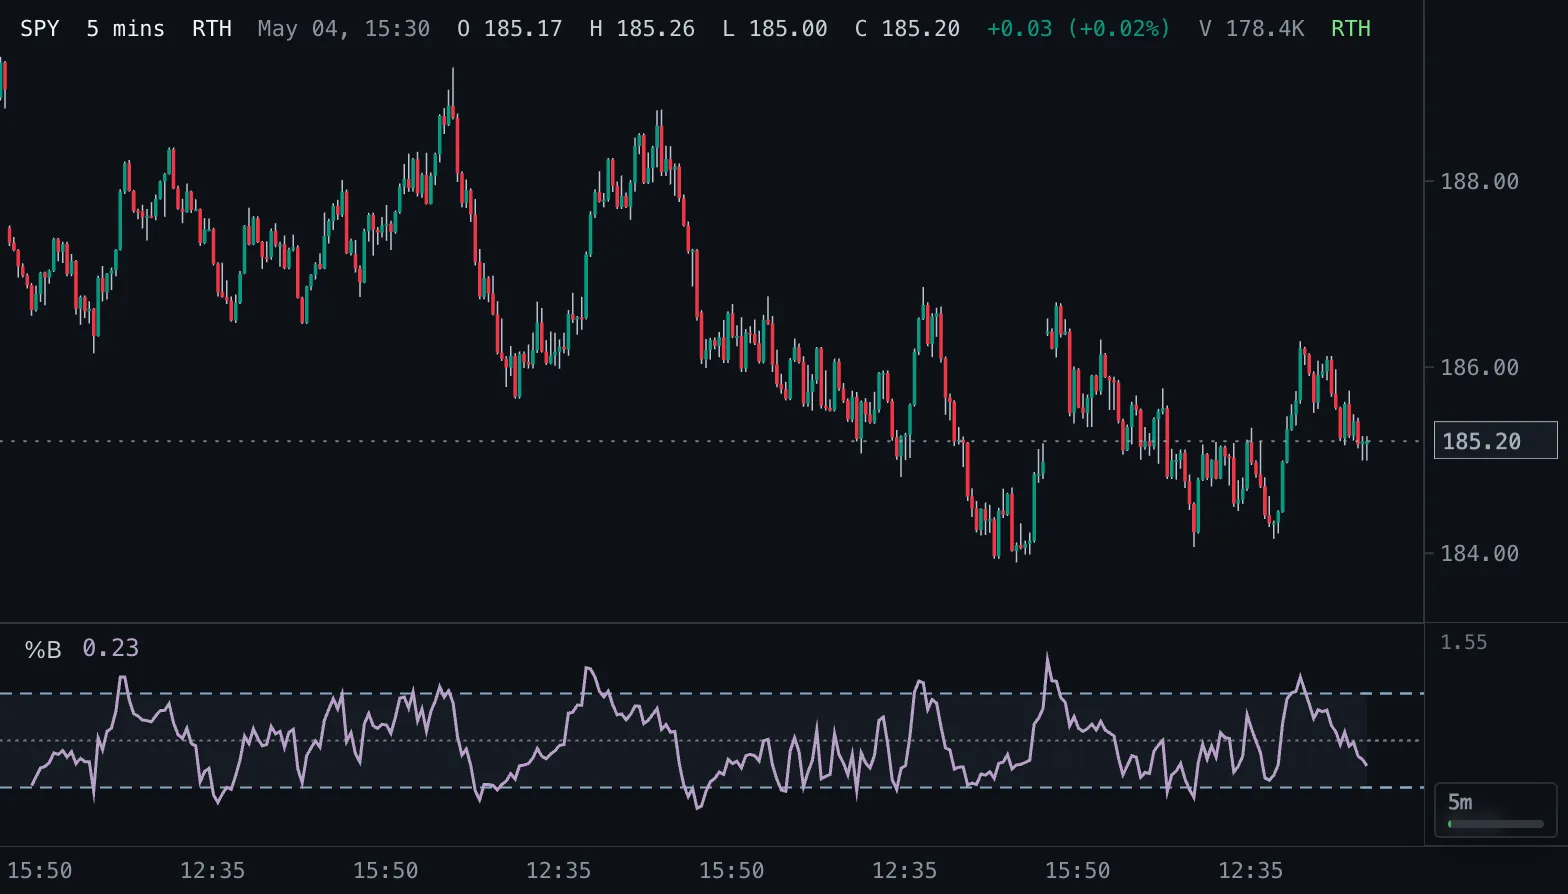
Bollinger %B %B
Where price sits within its Bollinger Bands: 1 at the upper band, 0.5 at the basis, 0 at the lower band.
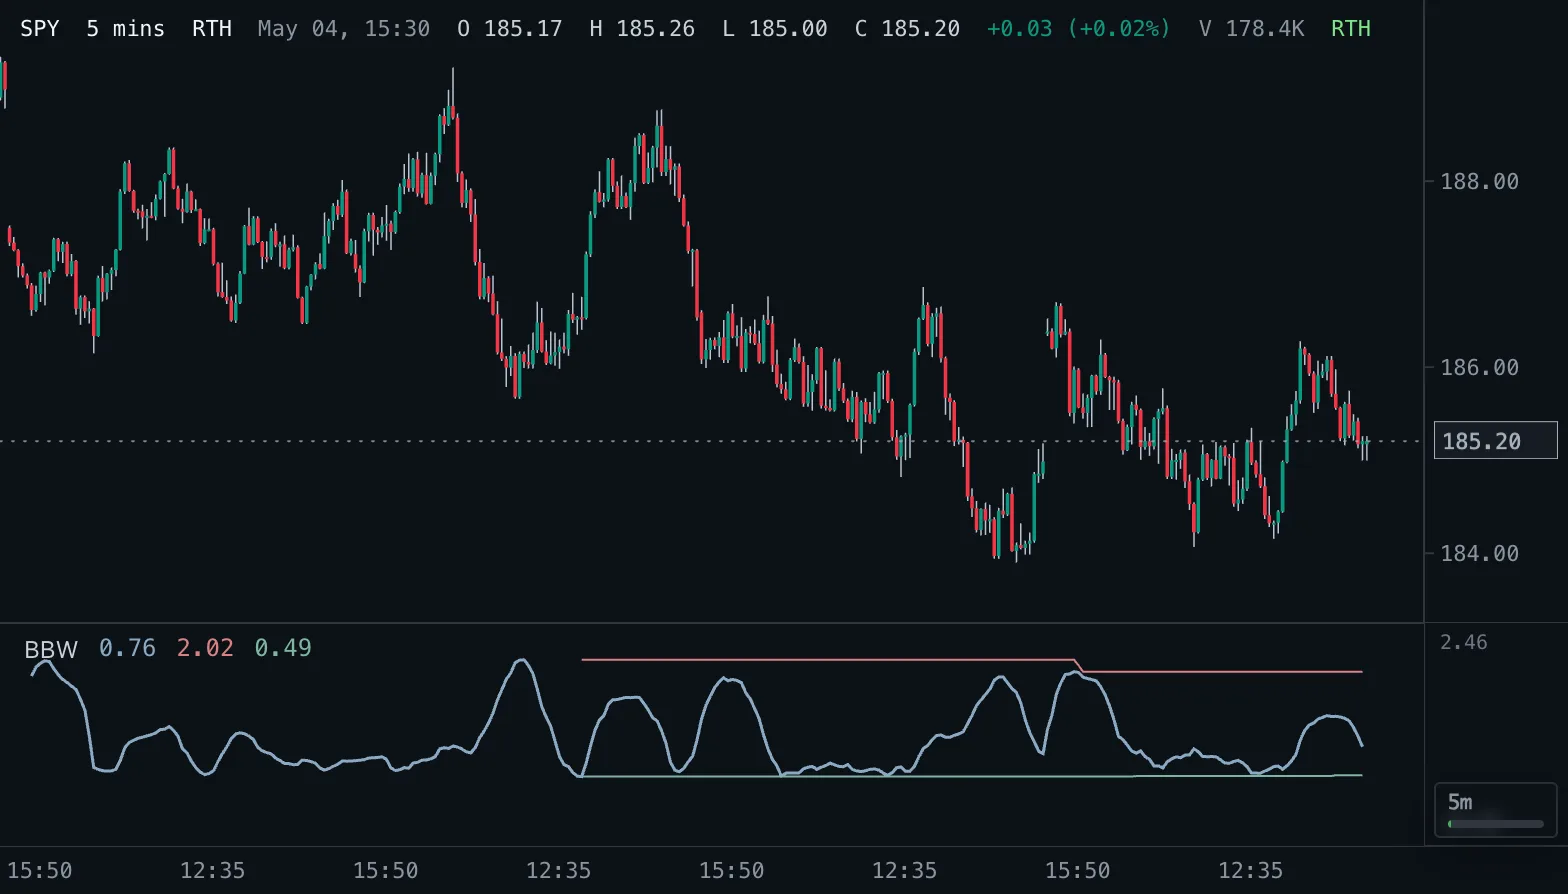
Bollinger BandWidth BBW
The width of the Bollinger Bands as a percentage of the basis, with its highest and lowest value over a longer lookback to spot squeezes.