Historical Volatility
Annualised standard deviation of log returns in percent, scaled correctly for the chart's bar size.
- HV
- Built into Spectral
- Updates at bar close
- historical volatility
- realized volatility
- standard deviation
- log returns
- annualized
- options
- volatility
MIT-0: free to use, change and share, no attribution needed. What you build from it is yours.
Already in Spectral: add it from the Indicators toolbox. The file here is the same indicator written as a custom indicator, to change or learn from. Installed, it appears next to the built-in one, marked Custom.
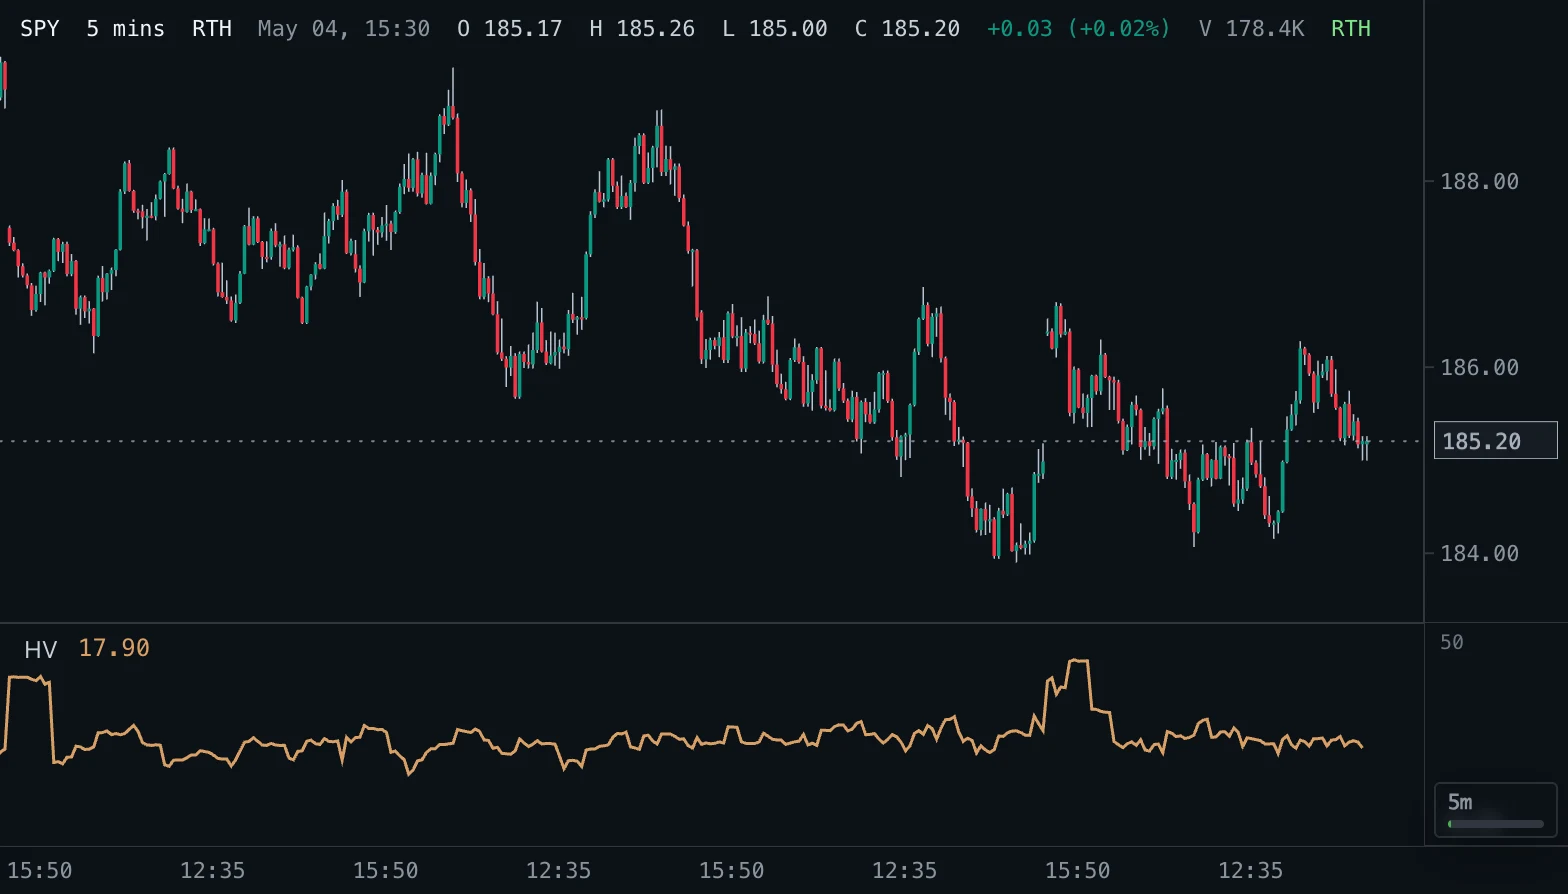
Overview
Historical Volatility (also called realised or statistical volatility) measures how much price has actually been moving. It takes the log return of every bar, the natural log of close divided by the previous close, computes their standard deviation over the last Length bars and annualises it, in percent.
A reading of 25 means that, if returns kept their recent spread for a whole year, a one-standard-deviation year would move price about 25 percent. This is the same scale as implied volatility quoted for options.
How to read it
Rising HV means bigger swings, falling HV calmer trading; it says nothing about direction. Volatility clusters and tends to revert to its own average, so very low readings often come before an expansion and spikes rarely last.
Option traders compare HV with implied volatility: implied well above historical means options price in more movement than the market has recently delivered, and the other way round. Compare HV between symbols to see which one moves more, independent of its price.
Settings and limitations
Length sets how many returns are measured: short lengths react quickly but are noisy; 20 to 30 daily bars (about a month) is the usual reference. Trading days per year sets the annualisation: 252 for exchange-traded markets, 365 for markets open every day.
The scaling follows the bar size: daily returns are multiplied by the square root of trading days per year, weekly by the square root of 52, monthly by the square root of 12, and intraday returns by the square root of trading days times bars per day. Bars per day is counted from the loaded history (the usual number of bars on a full day), so regular-hours and extended-hours charts both annualise correctly. With fewer than three days loaded, as on second charts, it assumes the 6.5-hour regular session, or 16 hours (04:00 to 20:00) when the chart shows extended hours, or 24 hours with 365 trading days. The first value appears after Length plus one bars. The value updates when each bar completes, not with the forming bar: on intraday charts the annualisation counts bars per day over the whole loaded history.
Notes
Uses the population standard deviation of log returns, as TradingView's Historical Volatility does. TradingView annualises with 365 days and applies the daily factor to intraday bars, so its intraday values are much smaller than an annual figure; on daily charts it reads about 20 percent higher than the 252-day convention used here (set Trading days per year to 365 to match it on daily bars). Gaps such as weekends and overnight count as one return each.
Settings
Each setting appears in the indicator's settings panel in Spectral, next to a color setting for every output.
| Setting | Type | Default | Range or options | What it does |
|---|---|---|---|---|
| Length | Whole number | 10 | 2 – 500 | Returns in the standard deviation. 10 matches TradingView; 20 or 21 is about one month of daily bars. |
| Trading days per year | Whole number | 252 | 1 – 366 | Trading days used to annualise. 252 for stocks and futures; 365 for markets that trade every day, such as crypto. |
Presets
Each preset is its own entry in the Indicators toolbox, with these settings changed.
| Toolbox entry | Short name | Settings |
|---|---|---|
| Historical Volatility (20) | HV 20 | Length: 20 |
| Historical Volatility (30) | HV 30 | Length: 30 |
| Historical Volatility (365 days) | HV 365d | Trading days per year: 365 |
What it draws
Lines
- HVsolid · 1.5 px · primary
#D9A066
Source
Save it as historical-volatility.js and add it with Indicators → Custom indicators → Add file…. The format is explained in the custom indicators guide.
// Copyright (c) 2026 Spectral
// SPDX-License-Identifier: MIT-0
// Free to use, copy, modify and share: https://spectral.trade/docs/custom-indicators/LICENSE.txt
/** @type {import('./spectral-indicator').IndicatorV2} */
export default {
  schemaVersion: 2,
  id: 'historical-volatility',
  name: 'Historical Volatility',
  shortName: 'HV',
  version: '1.0.0',
  author: 'Spectral',
  description: 'Annualised standard deviation of log returns in percent, scaled correctly for the chart\'s bar size.',
  pane: 'oscillator',
  live: 'none',
  inputs: {
    length: { type: 'integer', label: 'Length', default: 10, min: 2, max: 500, description: 'Returns in the standard deviation. 10 matches TradingView; 20 or 21 is about one month of daily bars.' },
    daysPerYear: { type: 'integer', label: 'Trading days per year', default: 252, min: 1, max: 366, description: 'Trading days used to annualise. 252 for stocks and futures; 365 for markets that trade every day, such as crypto.' },
  },
  plots: {
    hv: { label: 'HV', color: '#D9A066', lineWidth: 1.5, primary: true },
  },
  presets: [
    { id: 'hv-20', name: 'Historical Volatility (20)', shortName: 'HV 20', inputs: { length: 20 } },
    { id: 'hv-30', name: 'Historical Volatility (30)', shortName: 'HV 30', inputs: { length: 30 } },
    { id: 'every-day', name: 'Historical Volatility (365 days)', shortName: 'HV 365d', inputs: { daysPerYear: 365 } },
  ],
  docs: {
    overview: 'Historical Volatility (also called realised or statistical volatility) measures how much price has actually been moving. It takes the log return of every bar, the natural log of close divided by the previous close, computes their standard deviation over the last Length bars and annualises it, in percent.\n\nA reading of 25 means that, if returns kept their recent spread for a whole year, a one-standard-deviation year would move price about 25 percent. This is the same scale as implied volatility quoted for options.',
    howToRead: 'Rising HV means bigger swings, falling HV calmer trading; it says nothing about direction. Volatility clusters and tends to revert to its own average, so very low readings often come before an expansion and spikes rarely last.\n\nOption traders compare HV with implied volatility: implied well above historical means options price in more movement than the market has recently delivered, and the other way round. Compare HV between symbols to see which one moves more, independent of its price.',
    settings: 'Length sets how many returns are measured: short lengths react quickly but are noisy; 20 to 30 daily bars (about a month) is the usual reference. Trading days per year sets the annualisation: 252 for exchange-traded markets, 365 for markets open every day.\n\nThe scaling follows the bar size: daily returns are multiplied by the square root of trading days per year, weekly by the square root of 52, monthly by the square root of 12, and intraday returns by the square root of trading days times bars per day. Bars per day is counted from the loaded history (the usual number of bars on a full day), so regular-hours and extended-hours charts both annualise correctly. With fewer than three days loaded, as on second charts, it assumes the 6.5-hour regular session, or 16 hours (04:00 to 20:00) when the chart shows extended hours, or 24 hours with 365 trading days. The first value appears after Length plus one bars. The value updates when each bar completes, not with the forming bar: on intraday charts the annualisation counts bars per day over the whole loaded history.',
    notes: 'Uses the population standard deviation of log returns, as TradingView\'s Historical Volatility does. TradingView annualises with 365 days and applies the daily factor to intraday bars, so its intraday values are much smaller than an annual figure; on daily charts it reads about 20 percent higher than the 252-day convention used here (set Trading days per year to 365 to match it on daily bars). Gaps such as weekends and overnight count as one return each.',
  },
  calculate(ctx) {
    const { bars, inputs, ta, time } = ctx;
    const returns = bars.map((bar, index) => {
      const previous = index > 0 ? bars[index - 1].close : 0;
      return previous > 0 && bar.close > 0 ? Math.log(bar.close / previous) : null;
    });
    const deviation = ta.stdev(returns, inputs.length);
    const scale = 100 * Math.sqrt(periodsPerYear(ctx.barSize, inputs.daysPerYear, bars, time));
    return { plots: { hv: deviation.map((value) => (value === null ? null : value * scale)) } };
  },
};

/** Bars per year for the chart's bar size: per day, per week and per month exactly; intraday from the bars per day. */
function periodsPerYear(barSize, daysPerYear, bars, time) {
  const match = /^(\d+) (sec|min|hour|day|week|month)/.exec(barSize);
  const count = match ? Number(match[1]) : 1;
  const unit = match ? match[2] : 'day';
  if (unit === 'month') return 12 / count;
  if (unit === 'week') return 52 / count;
  if (unit === 'day') return daysPerYear / count;
  const seconds = count * (unit === 'sec' ? 1 : unit === 'min' ? 60 : 3600);
  return daysPerYear * barsPerDay(bars, time, seconds, daysPerYear);
}

/**
 * The typical number of bars in a full day of the loaded history: the median count of the days between the first
 * and the last date, which can both be partial. With fewer than three dates, the length of the session the bars
 * show: 24 hours for markets open every day, 16 hours with extended hours, else the 6.5-hour regular session.
 */
function barsPerDay(bars, time, seconds, daysPerYear) {
  const counts = [];
  let dateKey = null;
  for (const bar of bars) {
    const key = time.ny(bar).dateKey;
    if (key === dateKey) counts[counts.length - 1] += 1;
    else {
      counts.push(1);
      dateKey = key;
    }
  }
  const full = counts.slice(1, -1).sort((a, b) => a - b);
  if (full.length === 0) {
    const extended = bars.some((bar) => !time.isRegularSession(bar));
    const sessionSeconds = daysPerYear >= 365 ? 86400 : extended ? 57600 : 23400;
    return Math.max(1, Math.round(sessionSeconds / seconds));
  }
  return full[Math.floor((full.length - 1) / 2)];
}
Adapt it with an LLM
Paste this into your assistant and replace the second-to-last line with the change you want.
Start from this Spectral custom indicator: https://spectral.trade/indicators/historical-volatility.js
Format reference: https://spectral.trade/docs/custom-indicators.llm.md
Keep the file format and every rule of the reference; give the result a new id, name, shortName and version, and update docs and input descriptions to match.
Keep its live updates exact and fast (section "Fast live updates" of the reference): carry values from bar to bar only through ctx.ta, and raise live.lookback if the change reads further back; Spectral rejects a file whose live updates differ from a full recalculation or are too slow.
Change I want: <describe the change>
Answer with the complete file in one code block, ready to save as <id>.js.
Related indicators
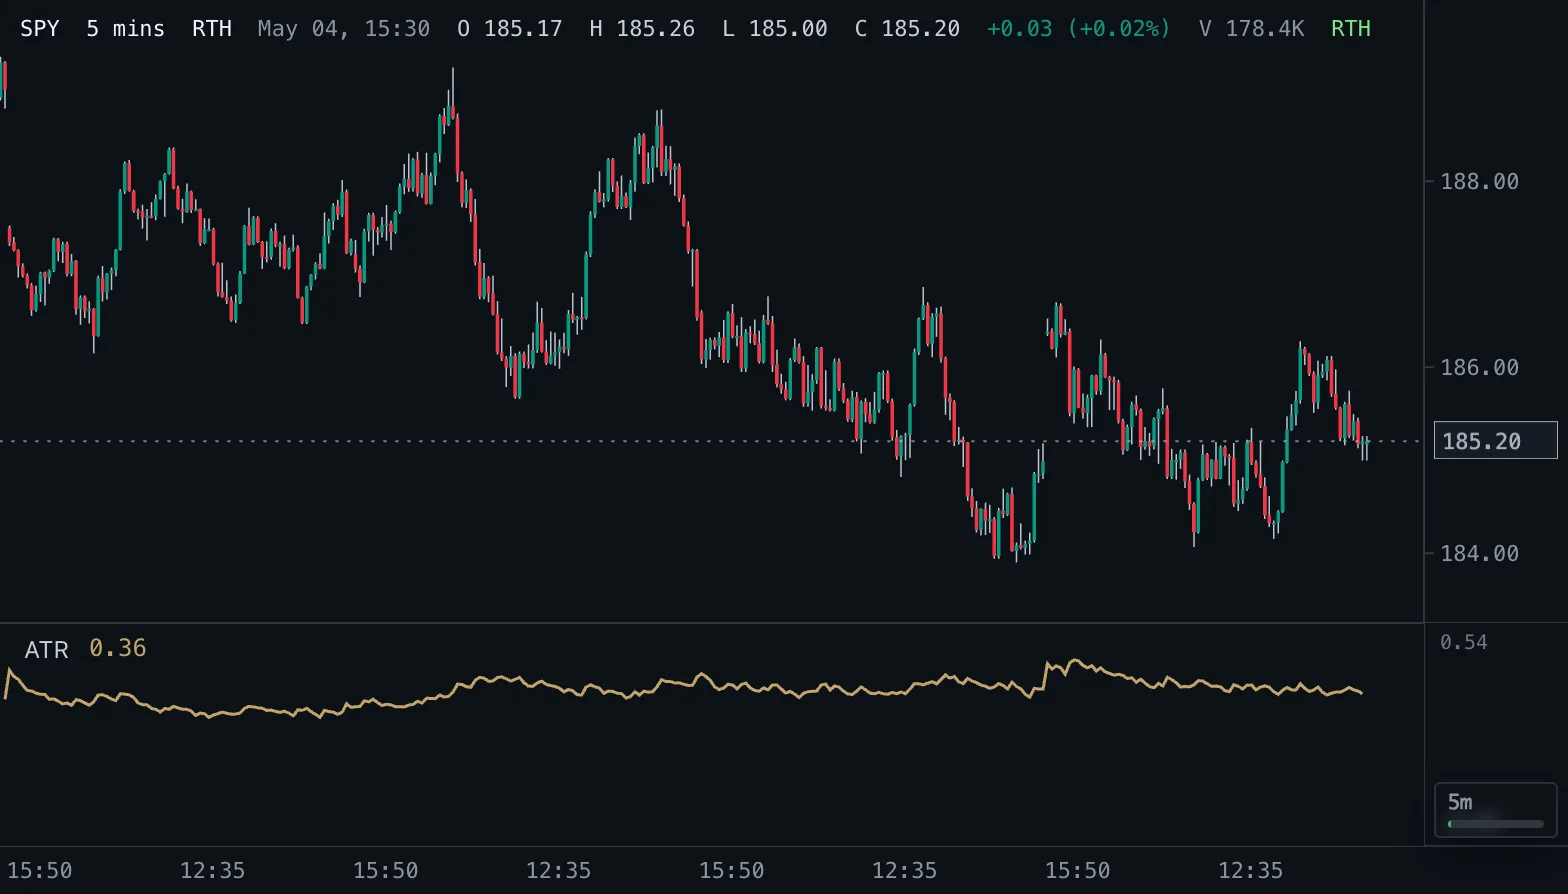
Average True Range ATR
Average True Range: the average size of a bar including gaps, in price units, with Wilder smoothing by default.
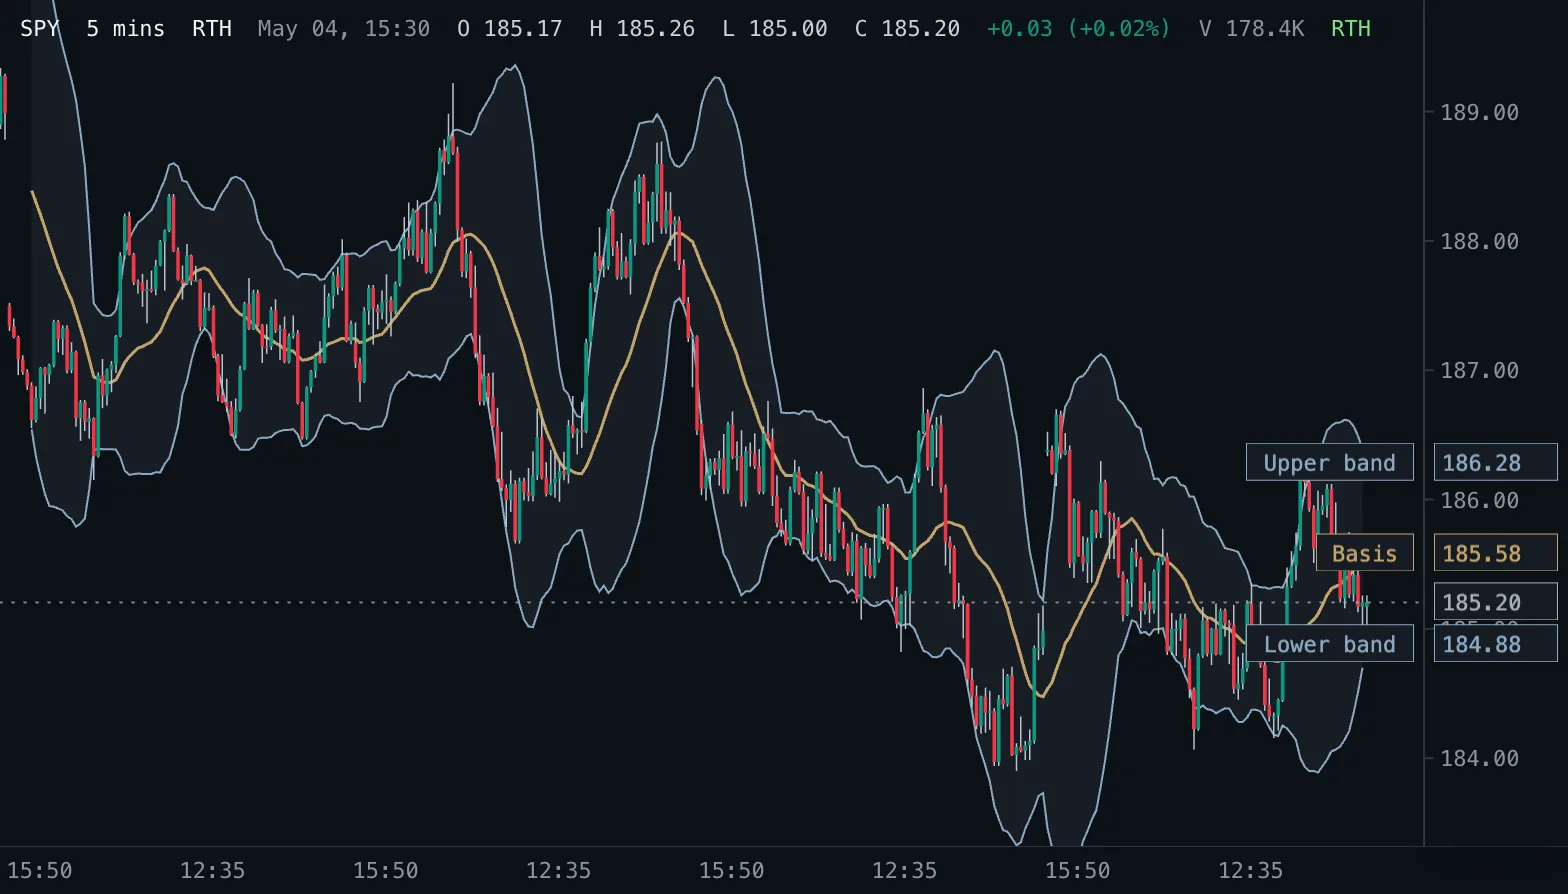
Bollinger Bands BB
A moving average with bands a chosen number of standard deviations above and below it, so the band width follows volatility.
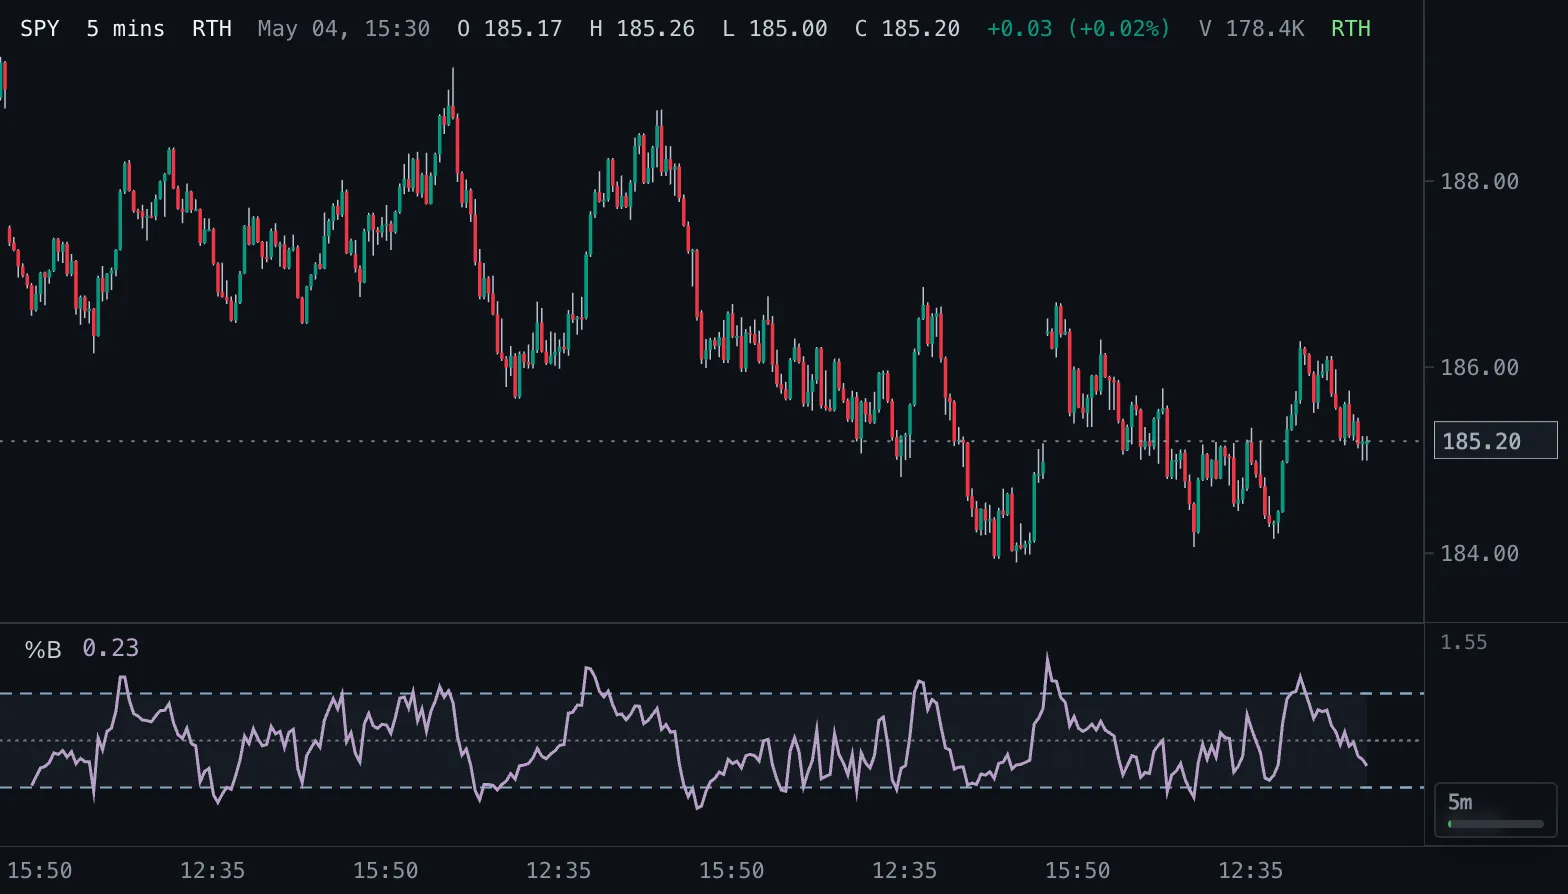
Bollinger %B %B
Where price sits within its Bollinger Bands: 1 at the upper band, 0.5 at the basis, 0 at the lower band.