Parabolic SAR
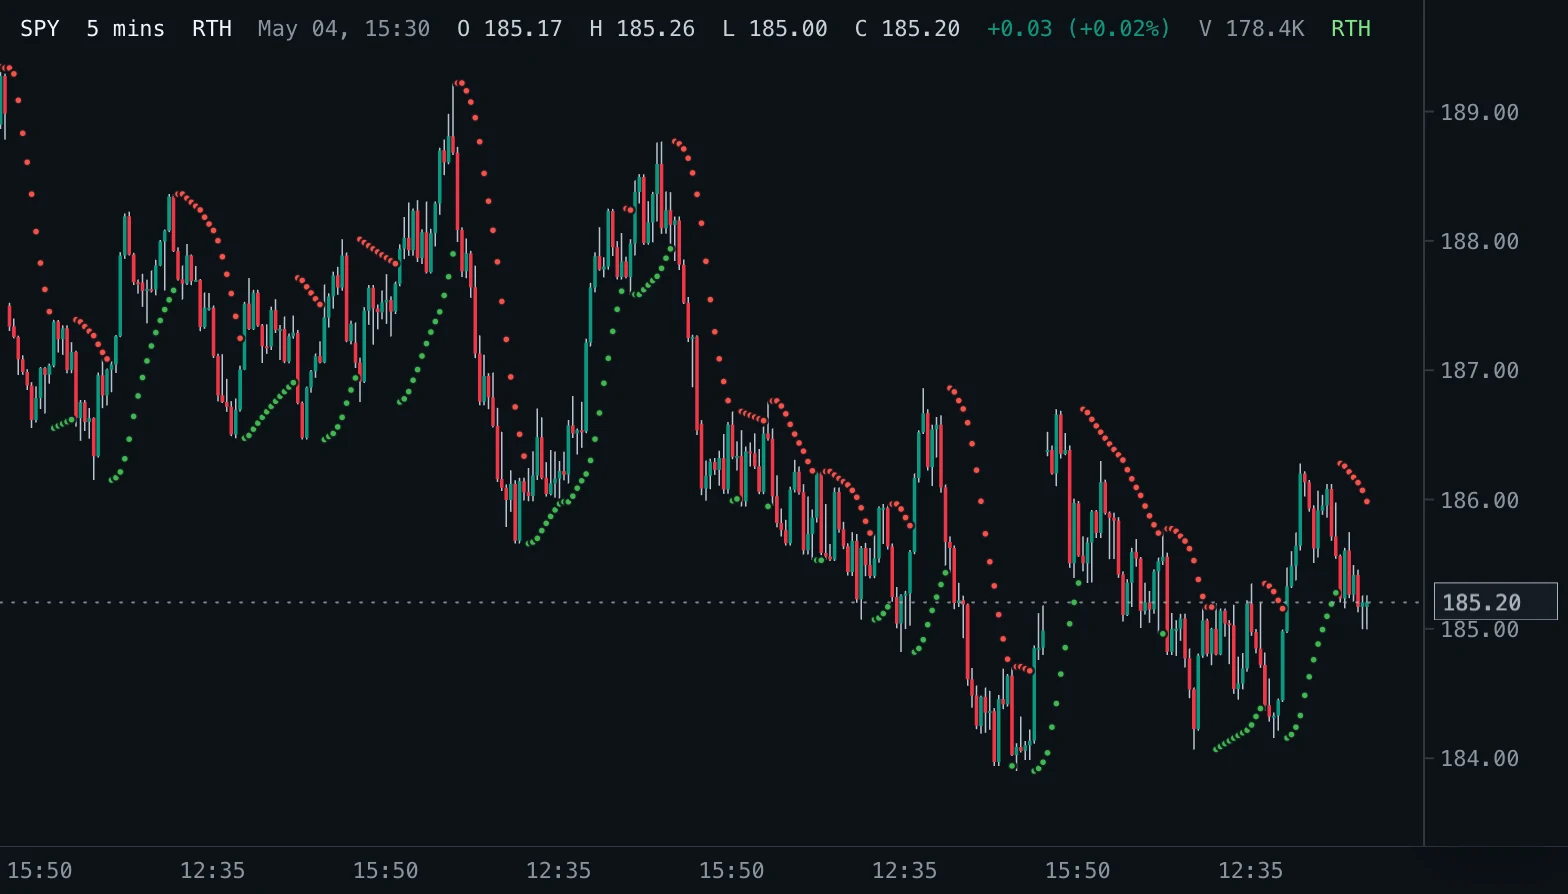
Wilder's stop and reverse: one dot per bar that trails price and speeds up as the trend makes new extremes.
- SAR
- Built into Spectral
- Updates every tick
- parabolic sar
- psar
- stop and reverse
- trailing stop
- wilder
- trend following
MIT-0: free to use, change and share, no attribution needed. What you build from it is yours.
Already in Spectral: add it from the Indicators toolbox. The file here is the same indicator written as a custom indicator, to change or learn from. Installed, it appears next to the built-in one, marked Custom.
Overview
The Parabolic SAR (stop and reverse) by J. Welles Wilder places one dot per bar. In an uptrend the dot sits below price and moves up every bar by a share of the distance to the trend's highest high; in a downtrend it sits above price and moves down toward the lowest low. The share starts small and grows with every new extreme, so the dots close in faster the longer a trend runs.
When price crosses the dot, the trend reverses: the dot jumps to the other side, to the extreme of the finished trend, and the share starts again.
How to read it
Green dots below price mark an uptrend and red dots above price a downtrend; each dot is a trailing stop for the current side. A switch of side is the classic stop-and-reverse signal.
In a strong trend the dots trail closely and keep a position until the trend ends. In a sideways market price crosses the dots often and the indicator flips back and forth, so many traders take its signals only in the direction of a trend filter such as a moving average or the ADX.
Settings and limitations
Start, Increment and Maximum are Wilder's acceleration factor settings, 0.02, 0.02 and 0.2 by default. A smaller Start and Increment trail further from price and flip less; a smaller Maximum keeps the dots from closing in too fast in long trends. The first dot appears on the second bar; on histories longer than 20,000 bars the dots cover the most recent 20,000, computed from the first bar.
Notes
Follows TradingView's built-in Parabolic SAR: the first trend is taken from the direction of the first two closes, a reversal happens when the bar's range crosses the dot, and the dot never sits inside the range of the two previous bars. On the forming bar a cross can flip the dots until the bar closes.
Settings
Each setting appears in the indicator's settings panel in Spectral, next to a color setting for every output.
| Setting | Type | Default | Range or options | What it does |
|---|---|---|---|---|
| Start | Number | 0.02 | 0.001 – 1, step 0.001 | Acceleration factor at the start of every trend: the share of the distance to the trend's extreme the dot moves on each bar. |
| Increment | Number | 0.02 | 0.001 – 1, step 0.001 | Added to the acceleration factor each time the trend makes a new high (up) or low (down). |
| Maximum | Number | 0.2 | 0.001 – 1, step 0.001 | Largest acceleration factor; the dots never close in faster than this. |
What it draws
Markers
- SAR below pricedot, radius 2
#3FB950 - SAR above pricedot, radius 2
#E5534B
Source
Save it as parabolic-sar.js and add it with Indicators → Custom indicators → Add file…. The format is explained in the custom indicators guide.
// Copyright (c) 2026 Spectral
// SPDX-License-Identifier: MIT-0
// Free to use, copy, modify and share: https://spectral.trade/docs/custom-indicators/LICENSE.txt
/** Spectral draws at most 20,000 markers per kind: dots go on the most recent bars. */
const MAX_DOTS = 20000;

/** @type {import('./spectral-indicator').IndicatorV2} */
export default {
  schemaVersion: 2,
  id: 'parabolic-sar',
  name: 'Parabolic SAR',
  shortName: 'SAR',
  version: '1.0.0',
  author: 'Spectral',
  description: 'Wilder\'s stop and reverse: one dot per bar that trails price and speeds up as the trend makes new extremes.',
  pane: 'price',
  live: { lookback: 2 },
  inputs: {
    start: { type: 'number', label: 'Start', default: 0.02, min: 0.001, max: 1, step: 0.001, description: 'Acceleration factor at the start of every trend: the share of the distance to the trend\'s extreme the dot moves on each bar.' },
    increment: { type: 'number', label: 'Increment', default: 0.02, min: 0.001, max: 1, step: 0.001, description: 'Added to the acceleration factor each time the trend makes a new high (up) or low (down).' },
    maximum: { type: 'number', label: 'Maximum', default: 0.2, min: 0.001, max: 1, step: 0.001, description: 'Largest acceleration factor; the dots never close in faster than this.' },
  },
  markers: {
    rising: { label: 'SAR below price', color: '#3FB950', radius: 2 },
    falling: { label: 'SAR above price', color: '#E5534B', radius: 2 },
  },
  docs: {
    overview: 'The Parabolic SAR (stop and reverse) by J. Welles Wilder places one dot per bar. In an uptrend the dot sits below price and moves up every bar by a share of the distance to the trend\'s highest high; in a downtrend it sits above price and moves down toward the lowest low. The share starts small and grows with every new extreme, so the dots close in faster the longer a trend runs.\n\nWhen price crosses the dot, the trend reverses: the dot jumps to the other side, to the extreme of the finished trend, and the share starts again.',
    howToRead: 'Green dots below price mark an uptrend and red dots above price a downtrend; each dot is a trailing stop for the current side. A switch of side is the classic stop-and-reverse signal.\n\nIn a strong trend the dots trail closely and keep a position until the trend ends. In a sideways market price crosses the dots often and the indicator flips back and forth, so many traders take its signals only in the direction of a trend filter such as a moving average or the ADX.',
    settings: 'Start, Increment and Maximum are Wilder\'s acceleration factor settings, 0.02, 0.02 and 0.2 by default. A smaller Start and Increment trail further from price and flip less; a smaller Maximum keeps the dots from closing in too fast in long trends. The first dot appears on the second bar; on histories longer than 20,000 bars the dots cover the most recent 20,000, computed from the first bar.',
    notes: 'Follows TradingView\'s built-in Parabolic SAR: the first trend is taken from the direction of the first two closes, a reversal happens when the bar\'s range crosses the dot, and the dot never sits inside the range of the two previous bars. On the forming bar a cross can flip the dots until the bar closes.',
  },
  calculate(ctx) {
    const { bars, inputs, ta } = ctx;
    const rising = [];
    const falling = [];
    const firstDot = Math.max(1, bars.length - MAX_DOTS);
    const items = bars.map((bar, index) => ({ bar, previous: bars[index - 1], older: bars[index - 2] }));
    // The dot, the trend's extreme, the acceleration and the side carry from bar to bar through ta.scan.
    const initial = { sar: 0, extreme: 0, acceleration: inputs.start, below: true };
    const states = ta.scan(items, initial, (state, item, index) => {
      // The first bar has no dot: the trend starts on the second.
      if (index === 0) return state;
      const { bar, previous } = item;
      let { sar, extreme, acceleration, below } = state;
      let firstTrendBar = false;
      if (index === 1) {
        below = bar.close > previous.close;
        extreme = below ? bar.high : bar.low;
        sar = below ? previous.low : previous.high;
        acceleration = inputs.start;
        firstTrendBar = true;
      }
      sar += acceleration * (extreme - sar);
      // Price crossing the dot reverses the trend: the dot moves to the extreme of the finished trend.
      if (below && sar > bar.low) {
        firstTrendBar = true;
        below = false;
        sar = Math.max(bar.high, extreme);
        extreme = bar.low;
        acceleration = inputs.start;
      } else if (!below && sar < bar.high) {
        firstTrendBar = true;
        below = true;
        sar = Math.min(bar.low, extreme);
        extreme = bar.high;
        acceleration = inputs.start;
      }
      if (!firstTrendBar) {
        if (below && bar.high > extreme) {
          extreme = bar.high;
          acceleration = Math.min(acceleration + inputs.increment, inputs.maximum);
        } else if (!below && bar.low < extreme) {
          extreme = bar.low;
          acceleration = Math.min(acceleration + inputs.increment, inputs.maximum);
        }
      }
      // The dot never enters the range of the two previous bars.
      const older = index > 1 ? item.older : previous;
      if (below) sar = Math.min(sar, previous.low, older.low);
      else sar = Math.max(sar, previous.high, older.high);
      return { sar, extreme, acceleration, below };
    });
    for (let index = firstDot; index < bars.length; index += 1) {
      const { sar, below } = states[index];
      (below ? rising : falling).push({ index, value: sar });
    }
    return { markers: { rising, falling } };
  },
};
Adapt it with an LLM
Paste this into your assistant and replace the second-to-last line with the change you want.
Start from this Spectral custom indicator: https://spectral.trade/indicators/parabolic-sar.js
Format reference: https://spectral.trade/docs/custom-indicators.llm.md
Keep the file format and every rule of the reference; give the result a new id, name, shortName and version, and update docs and input descriptions to match.
Keep its live updates exact and fast (section "Fast live updates" of the reference): carry values from bar to bar only through ctx.ta, and raise live.lookback if the change reads further back; Spectral rejects a file whose live updates differ from a full recalculation or are too slow.
Change I want: <describe the change>
Answer with the complete file in one code block, ready to save as <id>.js.
Related indicators
EMA Ribbon Ribbon
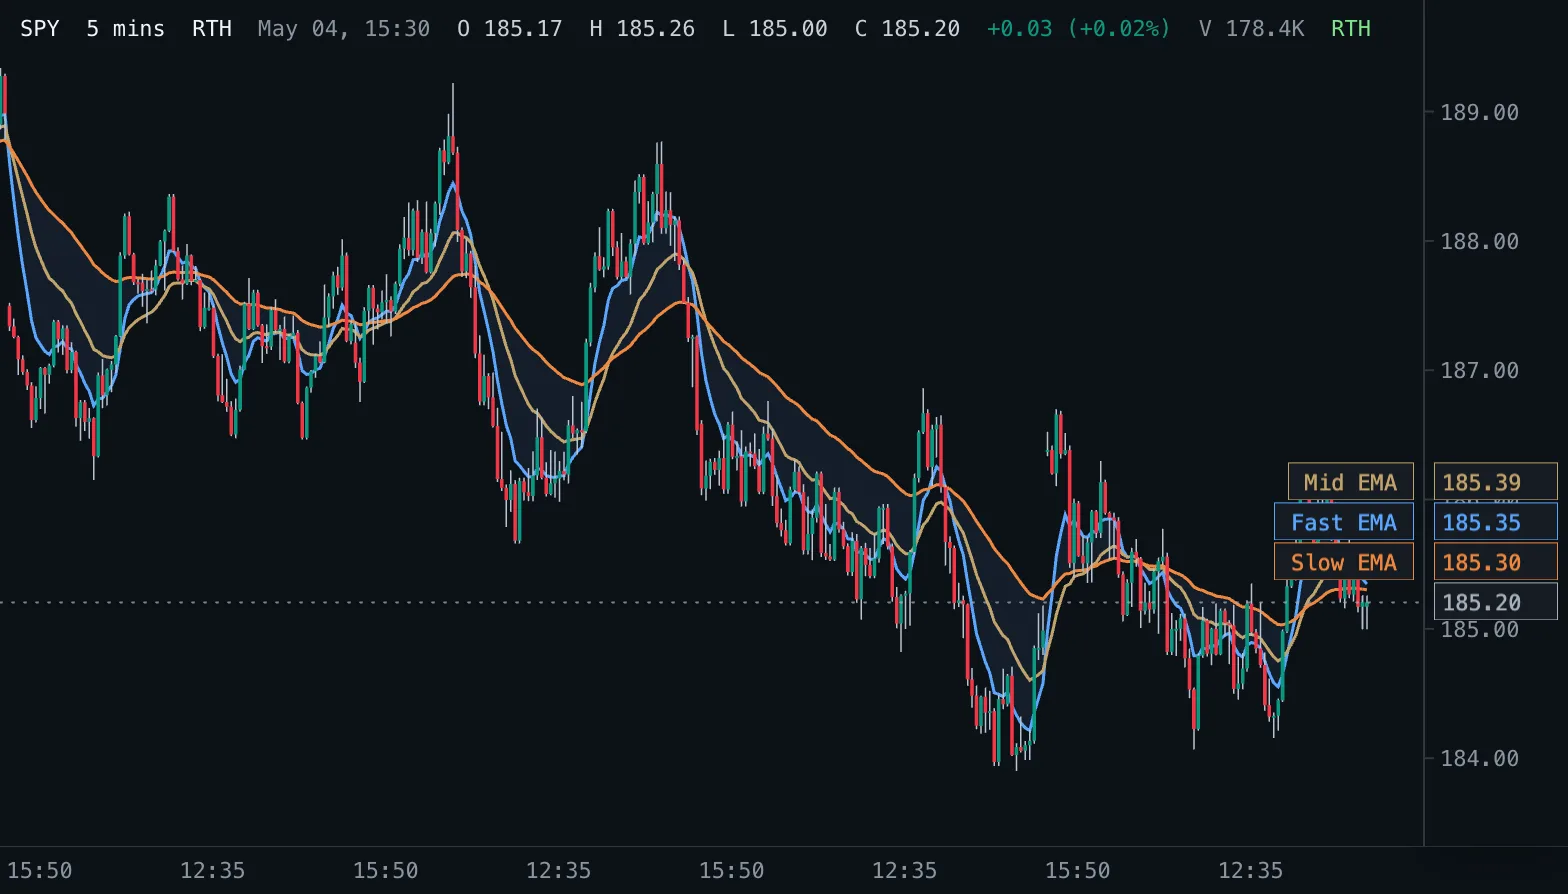
Three exponential moving averages on the price pane with a shaded band between the fastest and the slowest.
Exponential Moving Average EMA
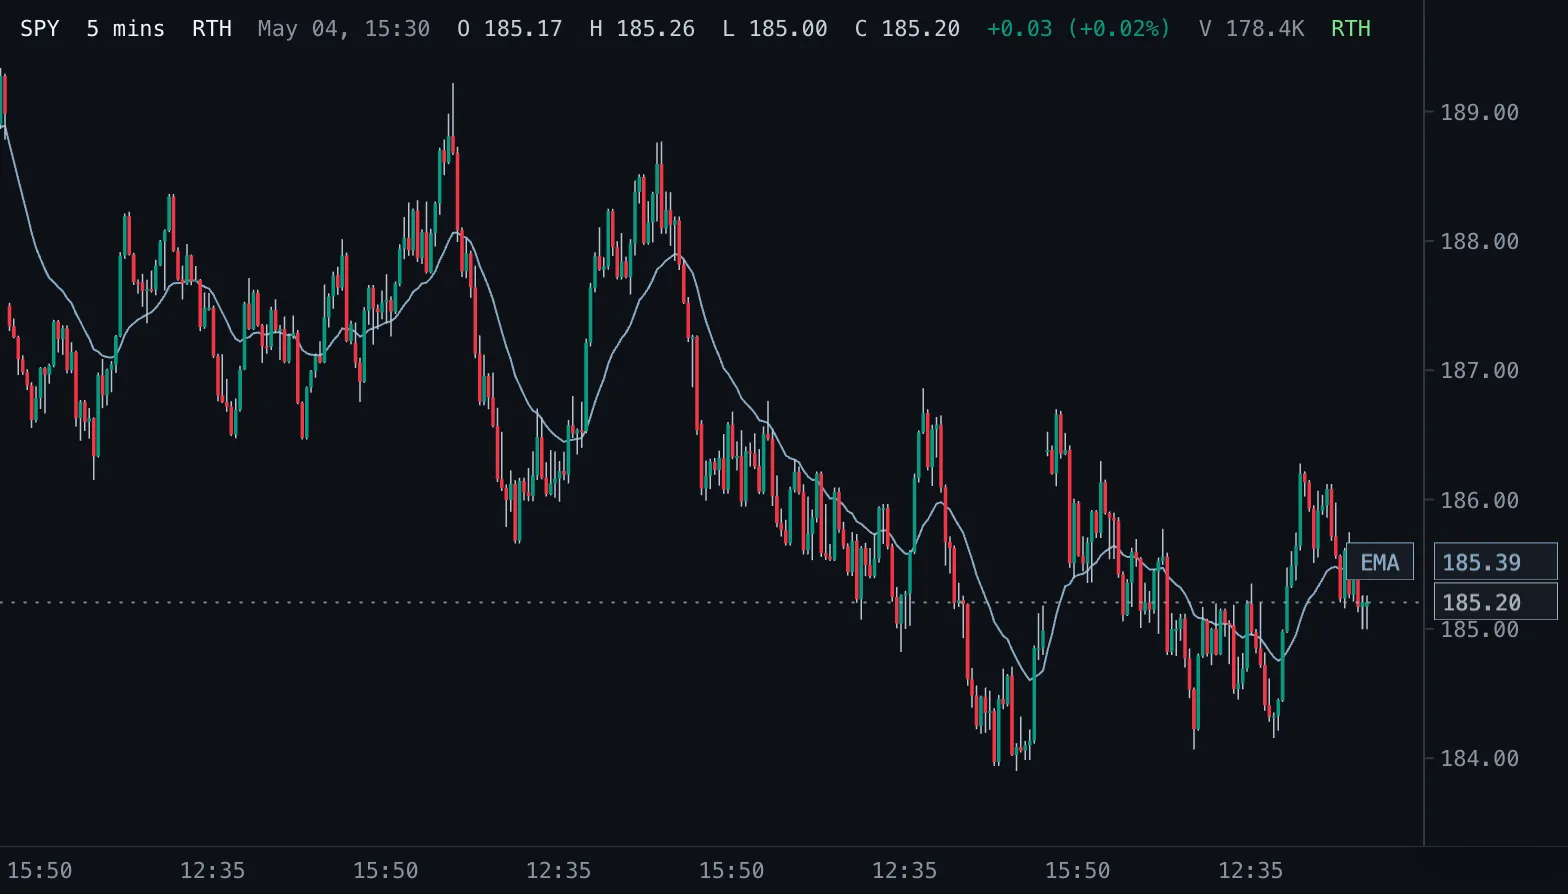
Exponential moving average of the chosen price, weighting recent bars more, drawn on the candles.
Ichimoku Cloud Ichimoku
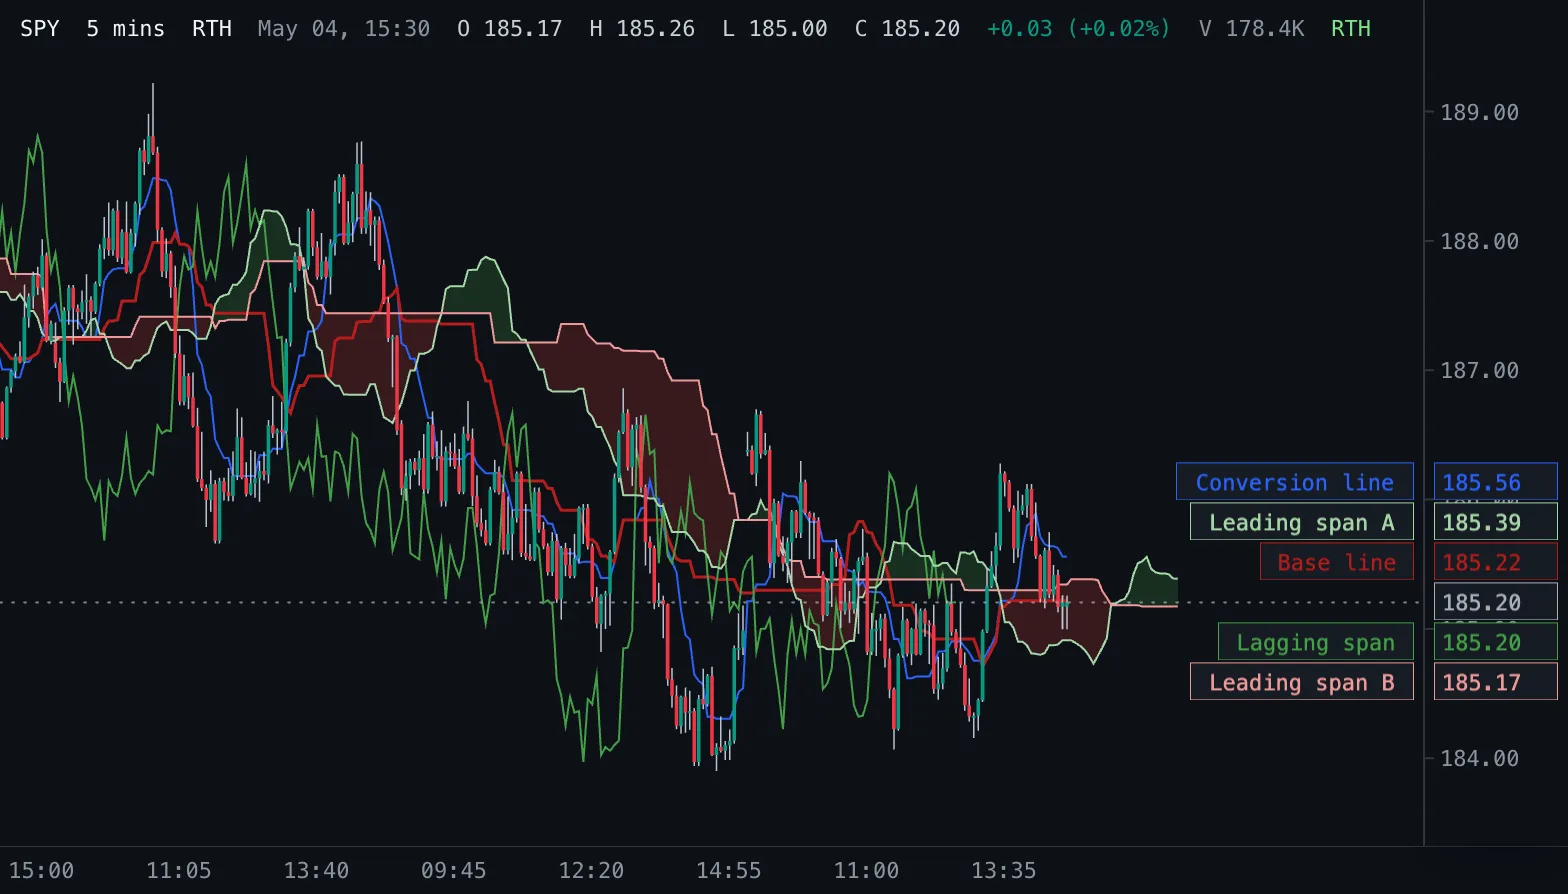
Ichimoku Kinko Hyo: conversion and base lines, a cloud of two leading spans projected into the future, and the lagging close.