Accumulation/Distribution
Running total of volume weighted by where each bar closes inside its range: rising on accumulation, falling on distribution.
- A/D
- Built into Spectral
- Updates every tick
- Uses volume
- accumulation distribution
- a/d line
- adl
- chaikin
- money flow
- divergence
MIT-0: free to use, change and share, no attribution needed. What you build from it is yours.
Already in Spectral: add it from the Indicators toolbox. The file here is the same indicator written as a custom indicator, to change or learn from. Installed, it appears next to the built-in one, marked Custom.
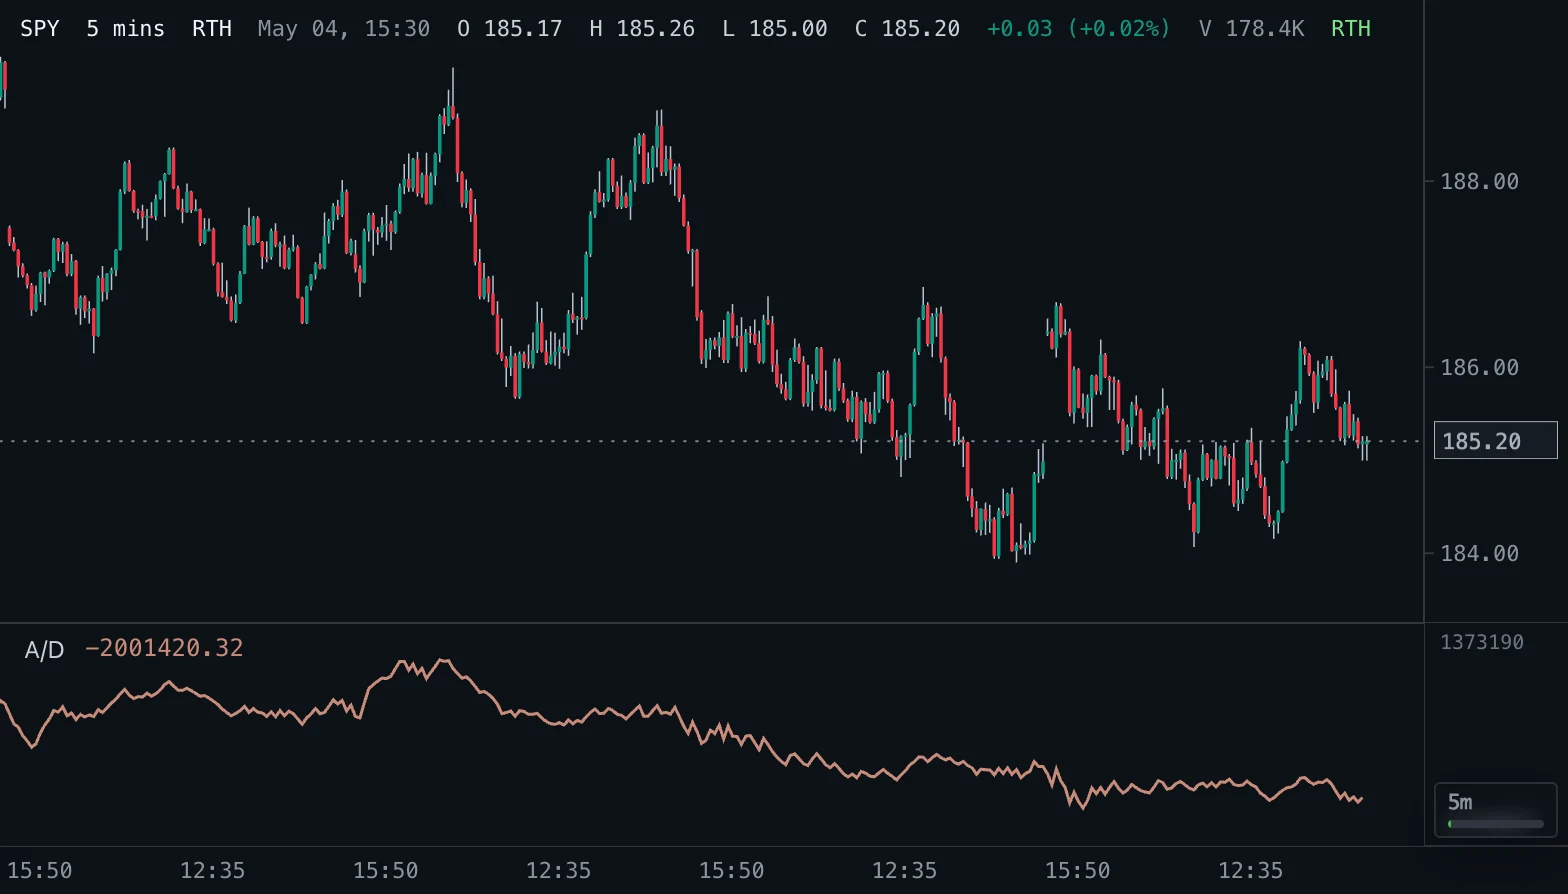
Overview
The Accumulation/Distribution line, by Marc Chaikin, adds up a share of each bar's volume depending on where the bar closes inside its own range. The money flow multiplier is ((close - low) - (high - close)) / (high - low): +1 when the bar closes on its high, -1 when it closes on its low, 0 in the middle. Multiplied by the volume it is added to the running total, which starts on the first loaded bar.
Unlike On Balance Volume, which uses the whole volume of a bar by the direction of the close versus the previous close, this line weighs volume by the position of the close inside the bar.
How to read it
A rising line shows accumulation: bars tend to close in the upper part of their range on volume. A falling line shows distribution. Look for agreement with price: a rising price with a rising line is confirmed, and a price that makes new highs while the line does not is a bearish divergence; the reverse at lows is a bullish divergence.
The absolute value has no meaning, only the slope and the divergences do. A gap between bars is ignored, because the multiplier only looks at the close inside the bar's own range, so strong gap moves can be underweighted.
Settings and limitations
Signal line switches an optional simple moving average of the A/D line on; Signal length sets its window (20 by default, first value after that many bars). The A/D line itself has no setting and has a value from the first bar.
The line is cumulative, so its level depends on how much history is loaded; scrolling back shifts it up or down without changing its shape. It works on every bar size, but on very small bar sizes many bars have a high equal to the low, which contribute nothing.
Notes
This is the standard Chaikin Accumulation/Distribution line and uses the same formula as TradingView: a bar whose high equals its low adds nothing. TradingView draws the same shape; only a constant offset can differ when the loaded history starts at another bar. The optional signal line is not part of the original definition and is off by default.
Settings
Each setting appears in the indicator's settings panel in Spectral, next to a color setting for every output.
| Setting | Type | Default | Range or options | What it does |
|---|---|---|---|---|
| Signal line | On / off | Off | — | Draw a simple moving average of the A/D line as a signal line. |
| Signal length | Whole number | 20 | 2 – 500 | Number of bars in the signal line average. Only used when the signal line is on. |
Presets
Each preset is its own entry in the Indicators toolbox, with these settings changed.
| Toolbox entry | Short name | Settings |
|---|---|---|
| A/D with signal (20) | A/D S20 | Signal line: trueSignal length: 20 |
What it draws
Lines
- A/Dsolid · 1.5 px · primary
#C98B7A - Signalsolid · 1 px
#8AA9C3
Source
Save it as accumulation-distribution.js and add it with Indicators → Custom indicators → Add file…. The format is explained in the custom indicators guide.
// Copyright (c) 2026 Spectral
// SPDX-License-Identifier: MIT-0
// Free to use, copy, modify and share: https://spectral.trade/docs/custom-indicators/LICENSE.txt
/** @type {import('./spectral-indicator').IndicatorV2} */
export default {
  schemaVersion: 2,
  id: 'accumulation-distribution',
  name: 'Accumulation/Distribution',
  shortName: 'A/D',
  version: '1.0.0',
  author: 'Spectral',
  description: 'Running total of volume weighted by where each bar closes inside its range: rising on accumulation, falling on distribution.',
  pane: 'oscillator',
  live: { lookback: 0 },
  usesVolume: true,
  inputs: {
    showSignal: { type: 'boolean', label: 'Signal line', default: false, description: 'Draw a simple moving average of the A/D line as a signal line.' },
    signalLength: { type: 'integer', label: 'Signal length', default: 20, min: 2, max: 500, description: 'Number of bars in the signal line average. Only used when the signal line is on.' },
  },
  plots: {
    adl: { label: 'A/D', color: '#C98B7A', lineWidth: 1.5, primary: true },
    signal: { label: 'Signal', color: '#8AA9C3' },
  },
  presets: [
    { id: 'signal-20', name: 'A/D with signal (20)', shortName: 'A/D S20', inputs: { showSignal: true, signalLength: 20 } },
  ],
  docs: {
    overview: 'The Accumulation/Distribution line, by Marc Chaikin, adds up a share of each bar\'s volume depending on where the bar closes inside its own range. The money flow multiplier is ((close - low) - (high - close)) / (high - low): +1 when the bar closes on its high, -1 when it closes on its low, 0 in the middle. Multiplied by the volume it is added to the running total, which starts on the first loaded bar.\n\nUnlike On Balance Volume, which uses the whole volume of a bar by the direction of the close versus the previous close, this line weighs volume by the position of the close inside the bar.',
    howToRead: 'A rising line shows accumulation: bars tend to close in the upper part of their range on volume. A falling line shows distribution. Look for agreement with price: a rising price with a rising line is confirmed, and a price that makes new highs while the line does not is a bearish divergence; the reverse at lows is a bullish divergence.\n\nThe absolute value has no meaning, only the slope and the divergences do. A gap between bars is ignored, because the multiplier only looks at the close inside the bar\'s own range, so strong gap moves can be underweighted.',
    settings: 'Signal line switches an optional simple moving average of the A/D line on; Signal length sets its window (20 by default, first value after that many bars). The A/D line itself has no setting and has a value from the first bar.\n\nThe line is cumulative, so its level depends on how much history is loaded; scrolling back shifts it up or down without changing its shape. It works on every bar size, but on very small bar sizes many bars have a high equal to the low, which contribute nothing.',
    notes: 'This is the standard Chaikin Accumulation/Distribution line and uses the same formula as TradingView: a bar whose high equals its low adds nothing. TradingView draws the same shape; only a constant offset can differ when the loaded history starts at another bar. The optional signal line is not part of the original definition and is off by default.',
  },
  calculate(ctx) {
    const { bars, inputs, ta } = ctx;
    const count = bars.length;
    // Each bar's money flow volume; ta.cum keeps the running total across bars.
    const flows = bars.map((bar) => {
      const volume = Number(bar.volume);
      const traded = Number.isFinite(volume) && volume > 0 ? volume : 0;
      const range = bar.high - bar.low;
      const multiplier = range > 0 ? ((bar.close - bar.low) - (bar.high - bar.close)) / range : 0;
      // + 0 turns a -0 flow into 0, as adding it to the running total from 0 does.
      return multiplier * traded + 0;
    });
    const adl = ta.cum(flows);
    const signal = inputs.showSignal ? ta.sma(adl, inputs.signalLength) : new Array(count).fill(null);
    return { plots: { adl, signal } };
  },
};
Adapt it with an LLM
Paste this into your assistant and replace the second-to-last line with the change you want.
Start from this Spectral custom indicator: https://spectral.trade/indicators/accumulation-distribution.js
Format reference: https://spectral.trade/docs/custom-indicators.llm.md
Keep the file format and every rule of the reference; give the result a new id, name, shortName and version, and update docs and input descriptions to match.
Keep its live updates exact and fast (section "Fast live updates" of the reference): carry values from bar to bar only through ctx.ta, and raise live.lookback if the change reads further back; Spectral rejects a file whose live updates differ from a full recalculation or are too slow.
Change I want: <describe the change>
Answer with the complete file in one code block, ready to save as <id>.js.
Related indicators
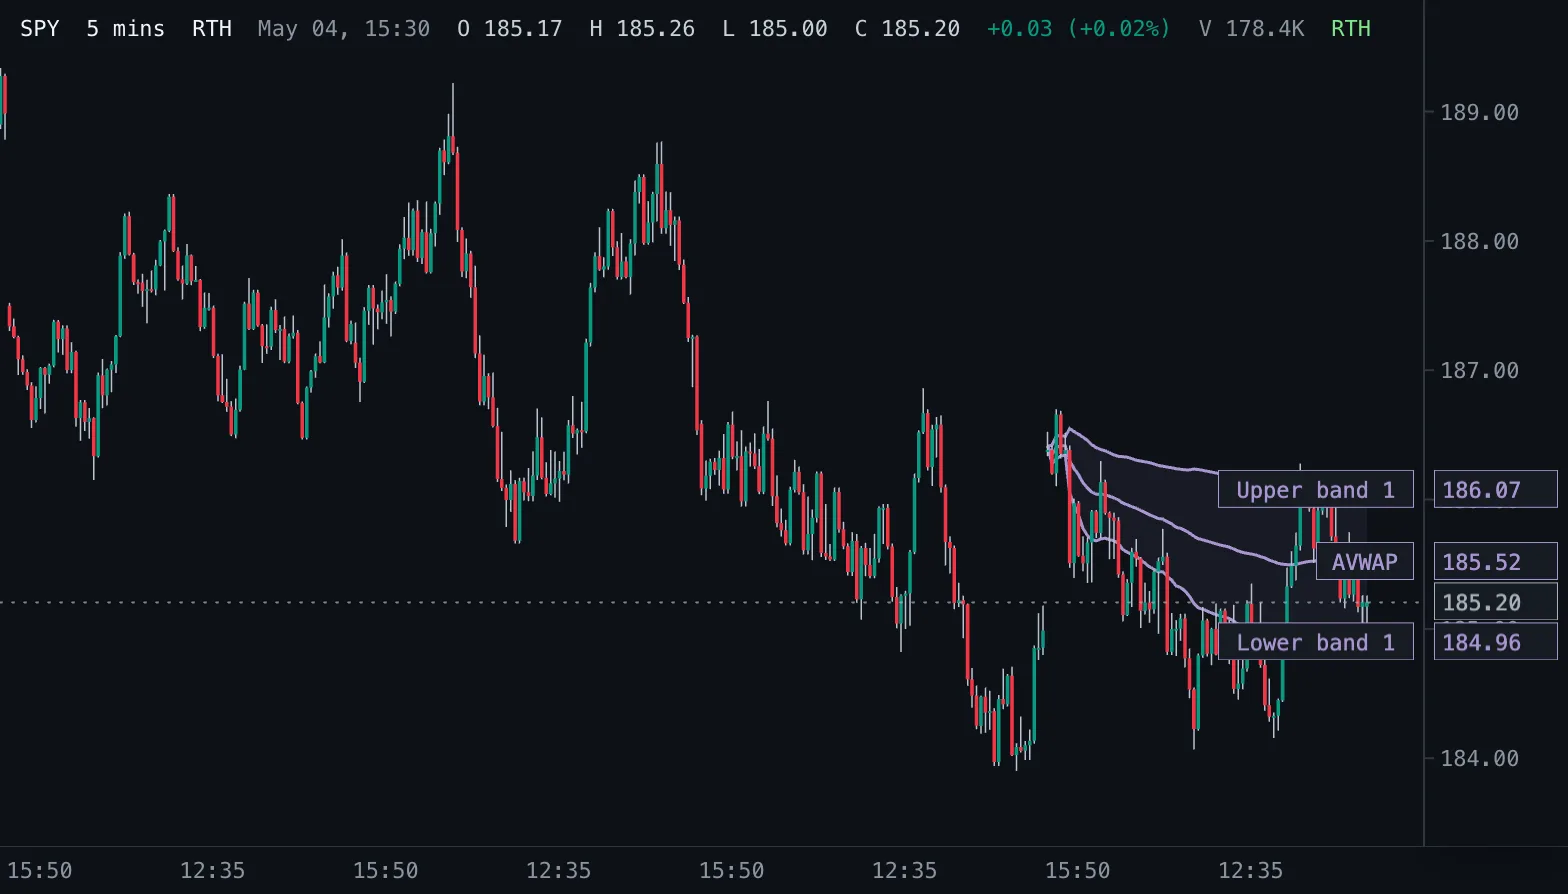
Anchored VWAP AVWAP
Volume-weighted average price counted from a chosen start time, with optional volume-weighted standard deviation bands.
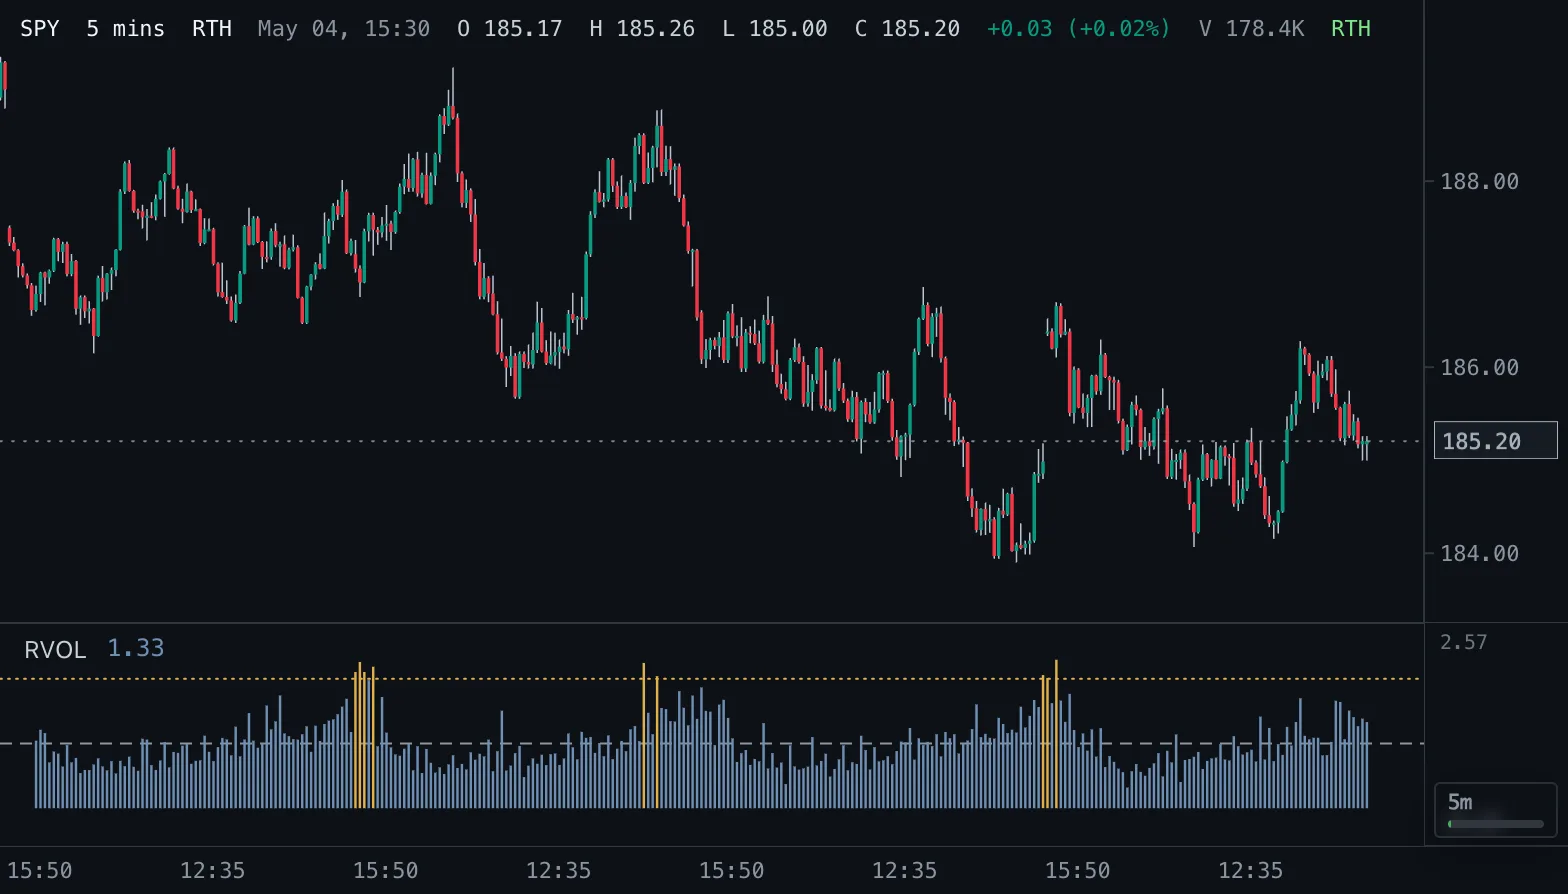
Relative Volume RVOL
Volume as a multiple of normal: against the average of the prior bars, or against the same time of day on earlier sessions.
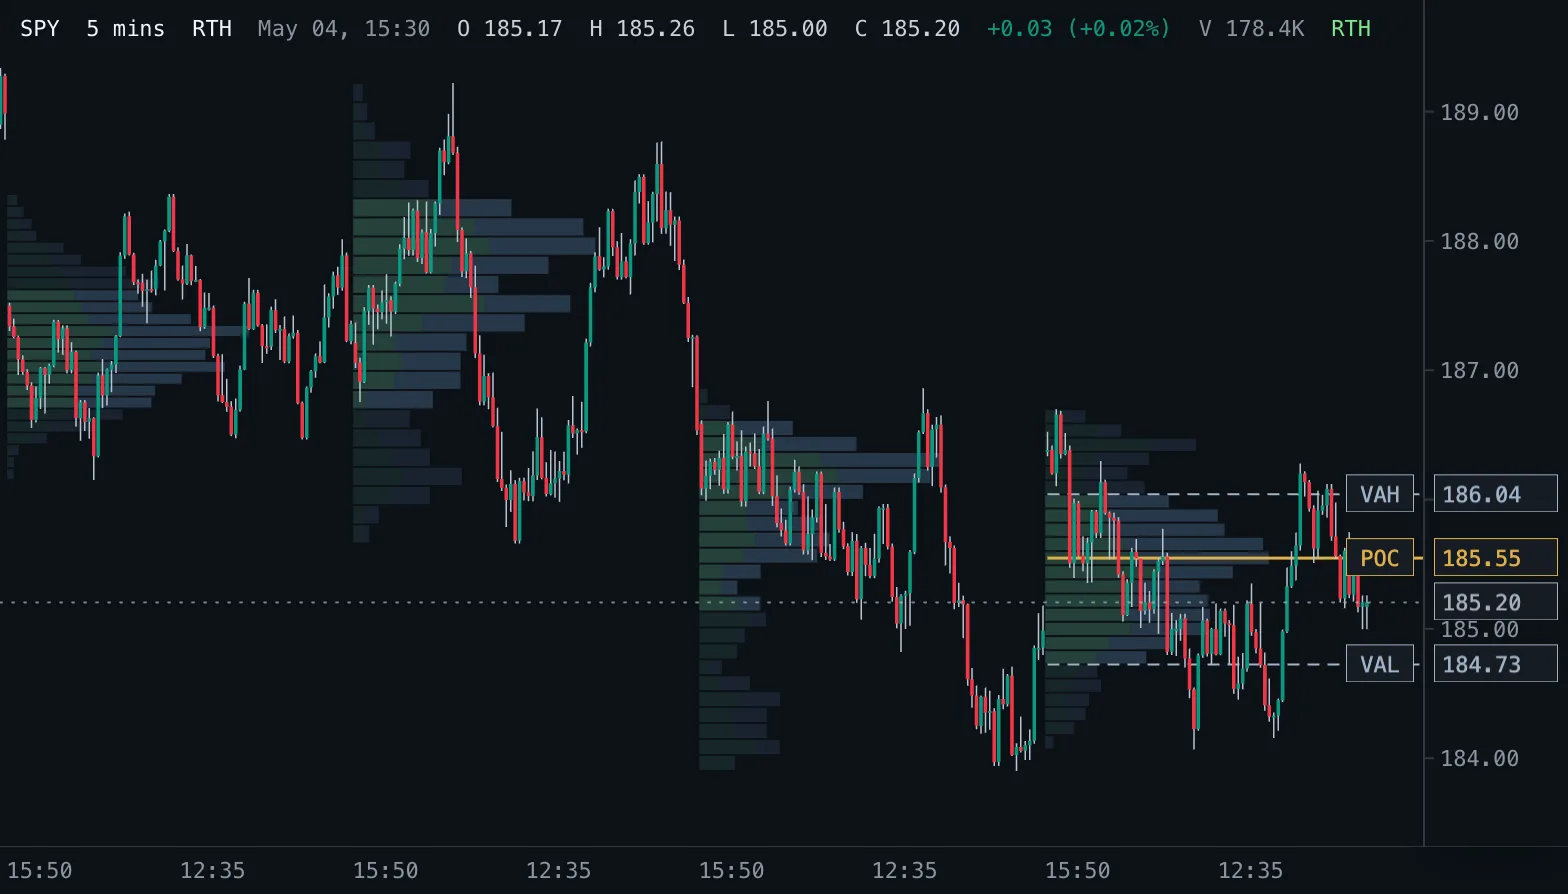
Volume Profile VP
Volume traded at each price as horizontal rows, per session, over a fixed range or for the bars on screen, with point of control and value area.