Kaufman Adaptive Moving Average
Perry Kaufman's adaptive moving average: fast when price trends cleanly, nearly flat when it chops, drawn on the candles.
- KAMA
- Built into Spectral
- Updates every tick
- kama
- kaufman
- adaptive
- moving average
- efficiency ratio
- trend
MIT-0: free to use, change and share, no attribution needed. What you build from it is yours.
Already in Spectral: add it from the Indicators toolbox. The file here is the same indicator written as a custom indicator, to change or learn from. Installed, it appears next to the built-in one, marked Custom.
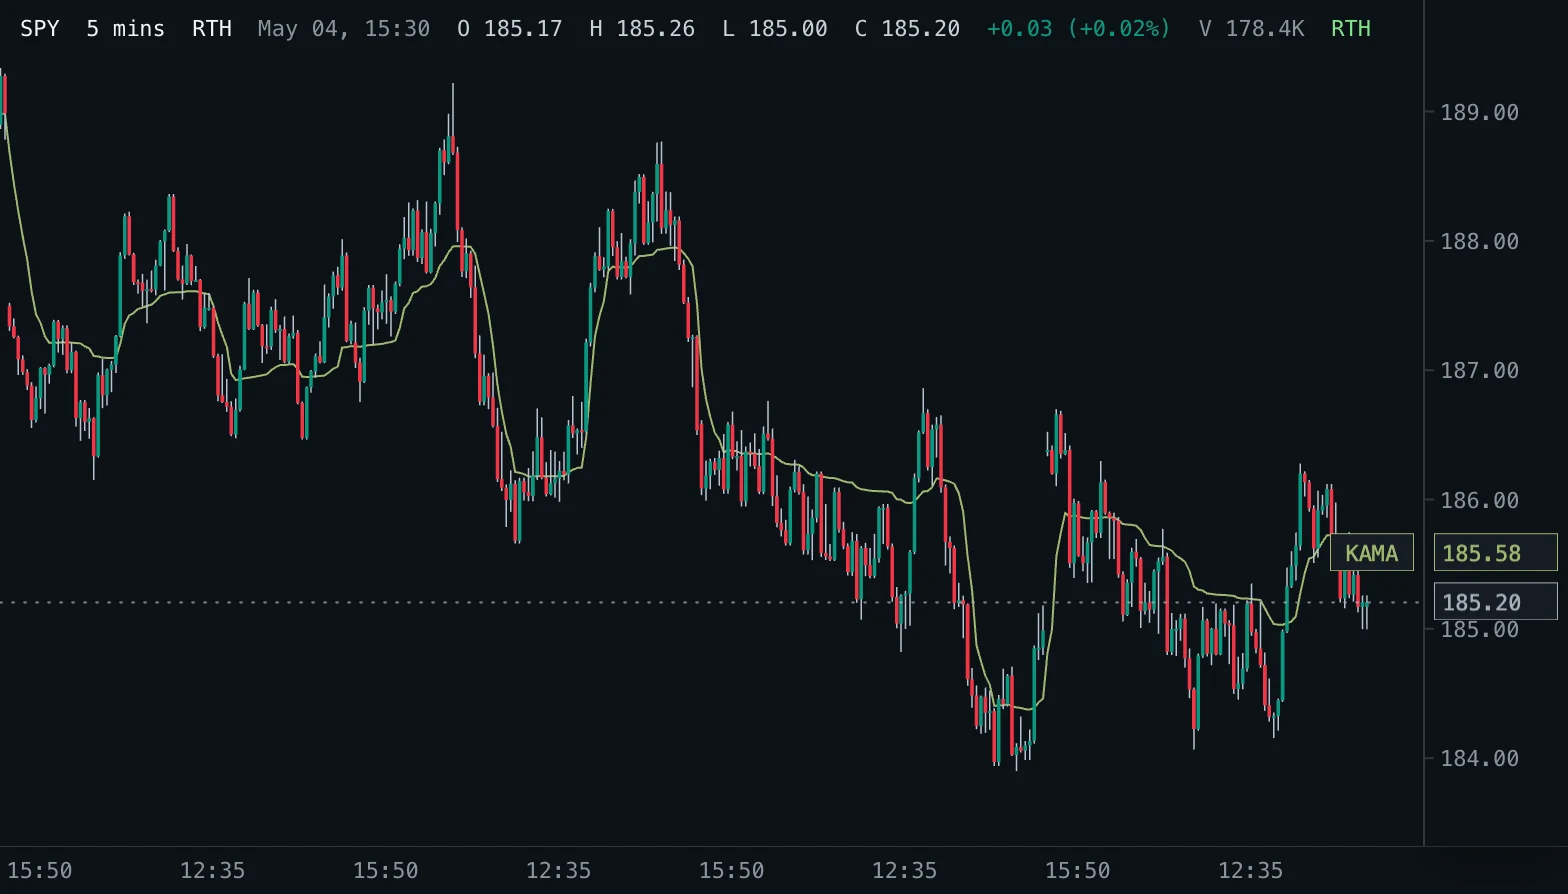
Overview
The Kaufman Adaptive Moving Average, described by Perry Kaufman in Smarter Trading (1995), changes its speed with the market. Over the last Efficiency length bars it divides the net price change by the sum of all bar-to-bar moves. This efficiency ratio is 1 when price moved in a straight line and near 0 when it went back and forth without getting anywhere.
The ratio sets the smoothing between the speed of a Fast length EMA and a Slow length EMA, and that value is squared, so noise slows the line down sharply. Each bar the average moves that fraction of the way from its previous value toward price.
How to read it
In a clean trend KAMA follows price closely; in a choppy range it goes almost flat and lets price swing around it. A flat KAMA therefore describes a market without direction, and a KAMA that starts to slope again shows that price has begun to move efficiently.
Because it barely moves on noise, price crossing a flat KAMA is less meaningful than the line itself turning. Many traders use its slope as a trend filter and its flat stretches as a sign to stand aside from trend trades.
Settings and limitations
The defaults 10, 2 and 30 are Kaufman's own and the most widely published. A longer Efficiency length judges the trend over more bars; the presets use 14 and 20. Fast length sets how closely the line can follow a strong trend; Slow length how still it stays in noise. Keep Fast below Slow.
The first value appears on bar Efficiency length + 1 and equals that bar's price; the line then adapts from there.
Notes
Follows Kaufman's definition: smoothing constant (ER x (fast - slow) + slow) squared, with fast and slow as 2 / (length + 1). The first value is that bar's price; other implementations start from the previous price or from a simple average, so the first values can differ until the line has adapted, after which they agree.
Settings
Each setting appears in the indicator's settings panel in Spectral, next to a color setting for every output.
| Setting | Type | Default | Range or options | What it does |
|---|---|---|---|---|
| Efficiency length | Whole number | 10 | 1 – 1000 | Bars over which the efficiency ratio compares the net price change with the total bar-to-bar movement. |
| Fast length | Whole number | 2 | 1 – 1000 | EMA length the average moves at when price trends perfectly (efficiency ratio 1). |
| Slow length | Whole number | 30 | 1 – 1000 | EMA length the average moves at when price goes nowhere (efficiency ratio 0). |
| Source | Price source | close | open, high, low, close, hlc3 | Price the average is calculated from. |
Presets
Each preset is its own entry in the Indicators toolbox, with these settings changed.
| Toolbox entry | Short name | Settings |
|---|---|---|
| KAMA 14 | KAMA 14 | Efficiency length: 14 |
| KAMA 20 | KAMA 20 | Efficiency length: 20 |
What it draws
Lines
- KAMAsolid · 1 px · primary
#9FB86F
Source
Save it as kama.js and add it with Indicators → Custom indicators → Add file…. The format is explained in the custom indicators guide.
// Copyright (c) 2026 Spectral
// SPDX-License-Identifier: MIT-0
// Free to use, copy, modify and share: https://spectral.trade/docs/custom-indicators/LICENSE.txt
/** @type {import('./spectral-indicator').IndicatorV2} */
export default {
  schemaVersion: 2,
  id: 'kama',
  name: 'Kaufman Adaptive Moving Average',
  shortName: 'KAMA',
  version: '1.0.0',
  author: 'Spectral',
  description: 'Perry Kaufman\'s adaptive moving average: fast when price trends cleanly, nearly flat when it chops, drawn on the candles.',
  pane: 'price',
  live: { lookback: 'length' },
  inputs: {
    length: { type: 'integer', label: 'Efficiency length', default: 10, min: 1, max: 1000, description: 'Bars over which the efficiency ratio compares the net price change with the total bar-to-bar movement.' },
    fastLength: { type: 'integer', label: 'Fast length', default: 2, min: 1, max: 1000, description: 'EMA length the average moves at when price trends perfectly (efficiency ratio 1).' },
    slowLength: { type: 'integer', label: 'Slow length', default: 30, min: 1, max: 1000, description: 'EMA length the average moves at when price goes nowhere (efficiency ratio 0).' },
    source: { type: 'source', label: 'Source', default: 'close', description: 'Price the average is calculated from.' },
  },
  plots: {
    kama: { label: 'KAMA', color: '#9FB86F', lineWidth: 1, primary: true },
  },
  presets: [
    { id: 'kama-14', name: 'KAMA 14', shortName: 'KAMA 14', inputs: { length: 14 } },
    { id: 'kama-20', name: 'KAMA 20', shortName: 'KAMA 20', inputs: { length: 20 } },
  ],
  docs: {
    overview: 'The Kaufman Adaptive Moving Average, described by Perry Kaufman in Smarter Trading (1995), changes its speed with the market. Over the last Efficiency length bars it divides the net price change by the sum of all bar-to-bar moves. This efficiency ratio is 1 when price moved in a straight line and near 0 when it went back and forth without getting anywhere.\n\nThe ratio sets the smoothing between the speed of a Fast length EMA and a Slow length EMA, and that value is squared, so noise slows the line down sharply. Each bar the average moves that fraction of the way from its previous value toward price.',
    howToRead: 'In a clean trend KAMA follows price closely; in a choppy range it goes almost flat and lets price swing around it. A flat KAMA therefore describes a market without direction, and a KAMA that starts to slope again shows that price has begun to move efficiently.\n\nBecause it barely moves on noise, price crossing a flat KAMA is less meaningful than the line itself turning. Many traders use its slope as a trend filter and its flat stretches as a sign to stand aside from trend trades.',
    settings: 'The defaults 10, 2 and 30 are Kaufman\'s own and the most widely published. A longer Efficiency length judges the trend over more bars; the presets use 14 and 20. Fast length sets how closely the line can follow a strong trend; Slow length how still it stays in noise. Keep Fast below Slow.\n\nThe first value appears on bar Efficiency length + 1 and equals that bar\'s price; the line then adapts from there.',
    notes: 'Follows Kaufman\'s definition: smoothing constant (ER x (fast - slow) + slow) squared, with fast and slow as 2 / (length + 1). The first value is that bar\'s price; other implementations start from the previous price or from a simple average, so the first values can differ until the line has adapted, after which they agree.',
  },
  calculate(ctx) {
    const { bars, inputs, ta } = ctx;
    const values = ta.source(bars, inputs.source);
    const momentum = ta.change(values, inputs.length);
    const path = ta.sum(ta.change(values, 1).map((change) => (change === null ? null : Math.abs(change))), inputs.length);
    const fast = 2 / (inputs.fastLength + 1);
    const slow = 2 / (inputs.slowLength + 1);
    const items = values.map((value, index) => ({ value, move: momentum[index], total: path[index] }));
    // KAMA carries its previous value from bar to bar through ta.scan; it starts at the first price with a value.
    const kama = ta.scan(items, null, (previous, { value, move, total }) => {
      if (move === null || total === null) return previous;
      const efficiency = total > 0 ? Math.abs(move) / total : 0;
      const smoothing = efficiency * (fast - slow) + slow;
      const alpha = smoothing * smoothing;
      const base = previous === null ? value : previous;
      return alpha * value + (1 - alpha) * base;
    });
    return { plots: { kama } };
  },
};
Adapt it with an LLM
Paste this into your assistant and replace the second-to-last line with the change you want.
Start from this Spectral custom indicator: https://spectral.trade/indicators/kama.js
Format reference: https://spectral.trade/docs/custom-indicators.llm.md
Keep the file format and every rule of the reference; give the result a new id, name, shortName and version, and update docs and input descriptions to match.
Keep its live updates exact and fast (section "Fast live updates" of the reference): carry values from bar to bar only through ctx.ta, and raise live.lookback if the change reads further back; Spectral rejects a file whose live updates differ from a full recalculation or are too slow.
Change I want: <describe the change>
Answer with the complete file in one code block, ready to save as <id>.js.
Related indicators
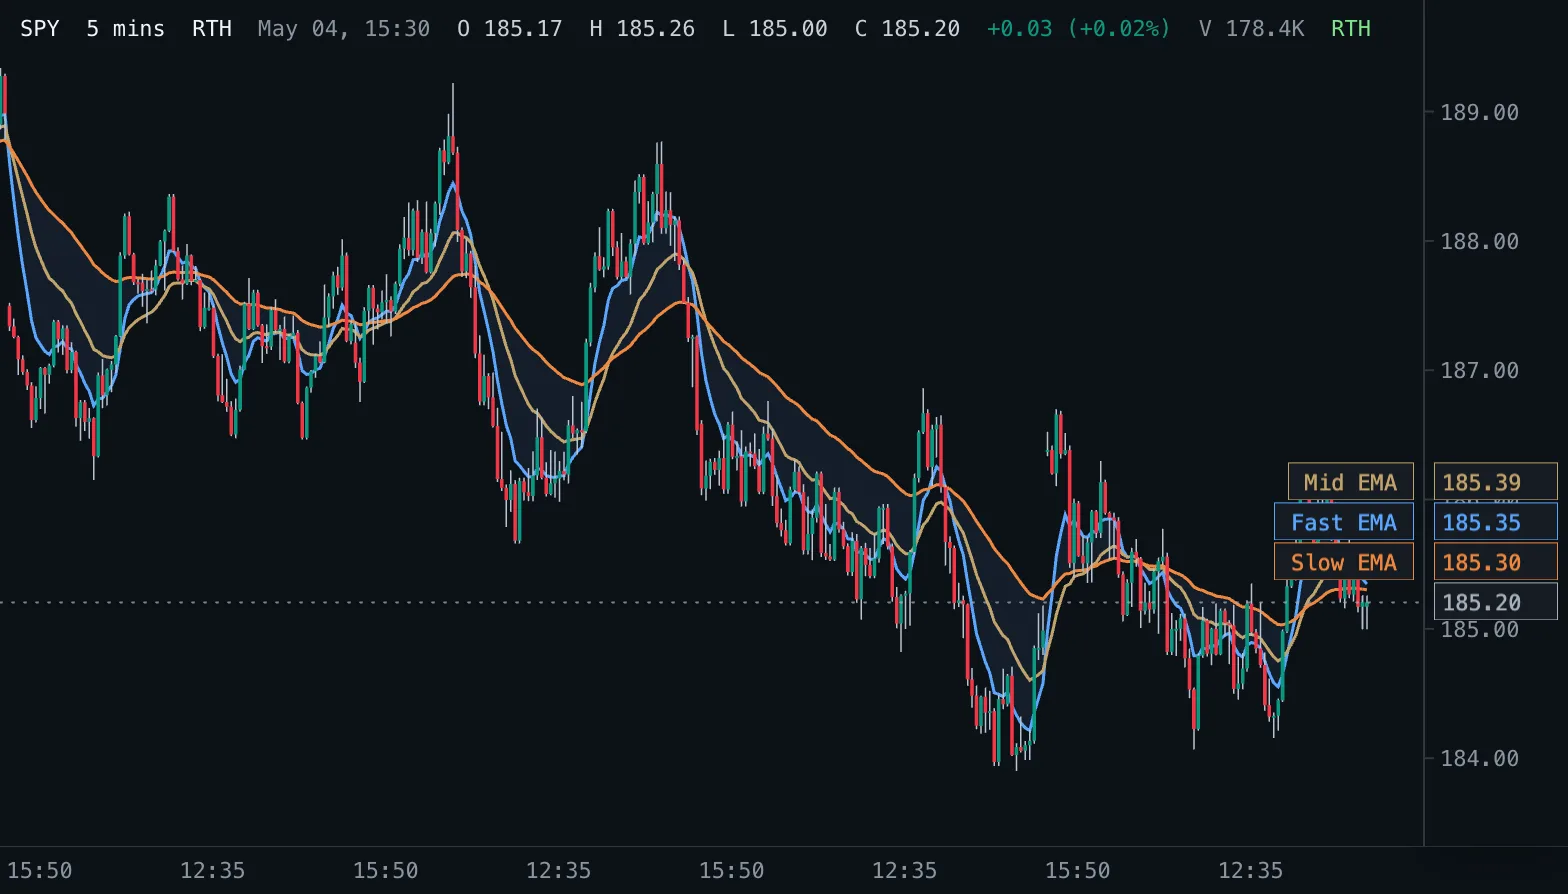
EMA Ribbon Ribbon
Three exponential moving averages on the price pane with a shaded band between the fastest and the slowest.
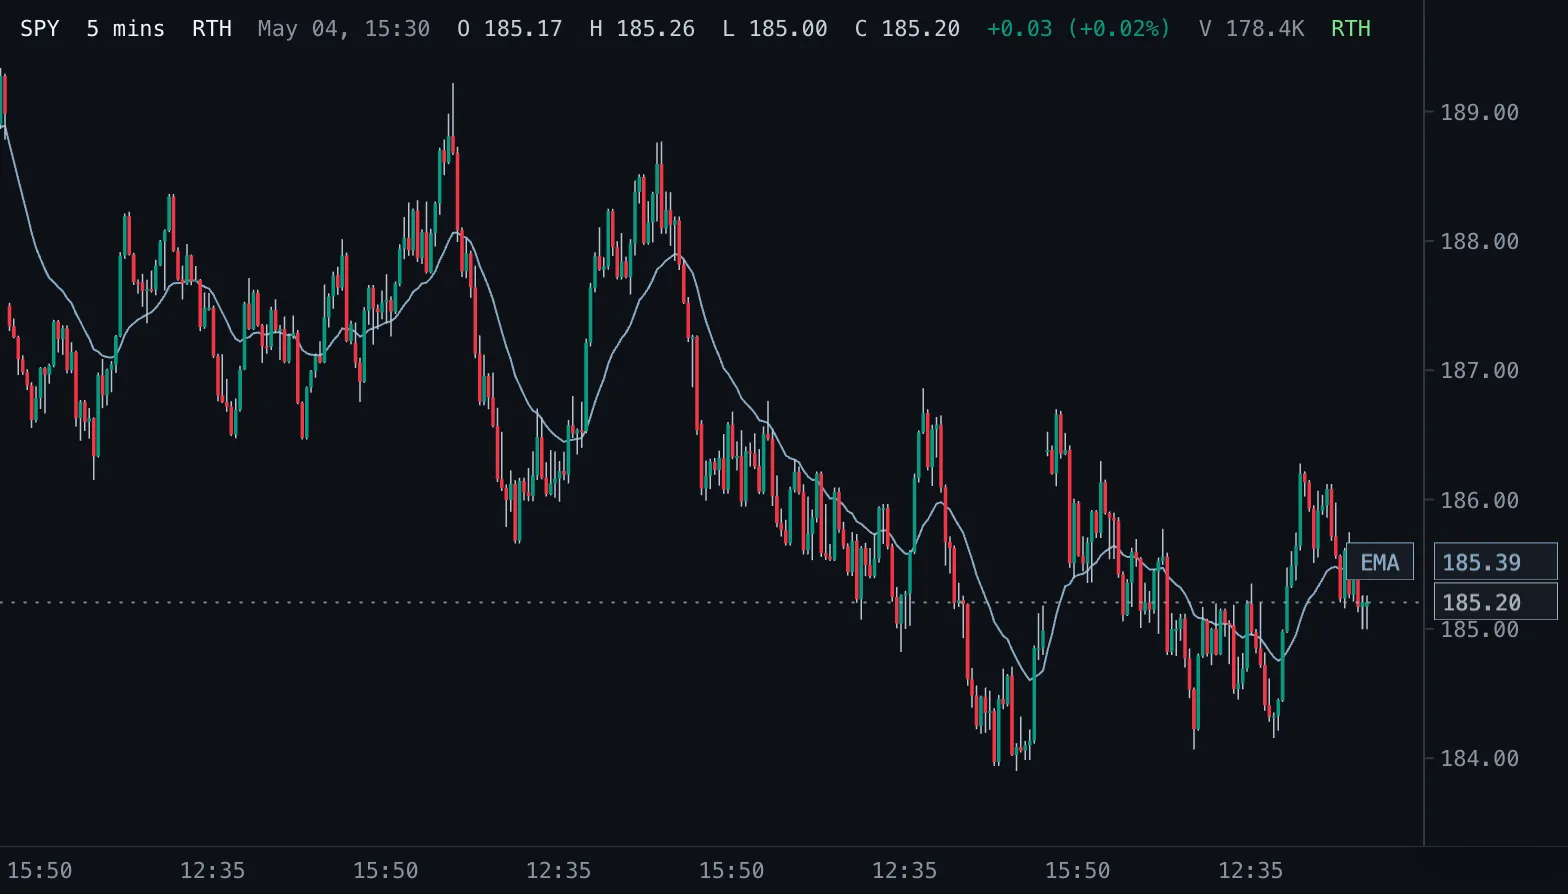
Exponential Moving Average EMA
Exponential moving average of the chosen price, weighting recent bars more, drawn on the candles.
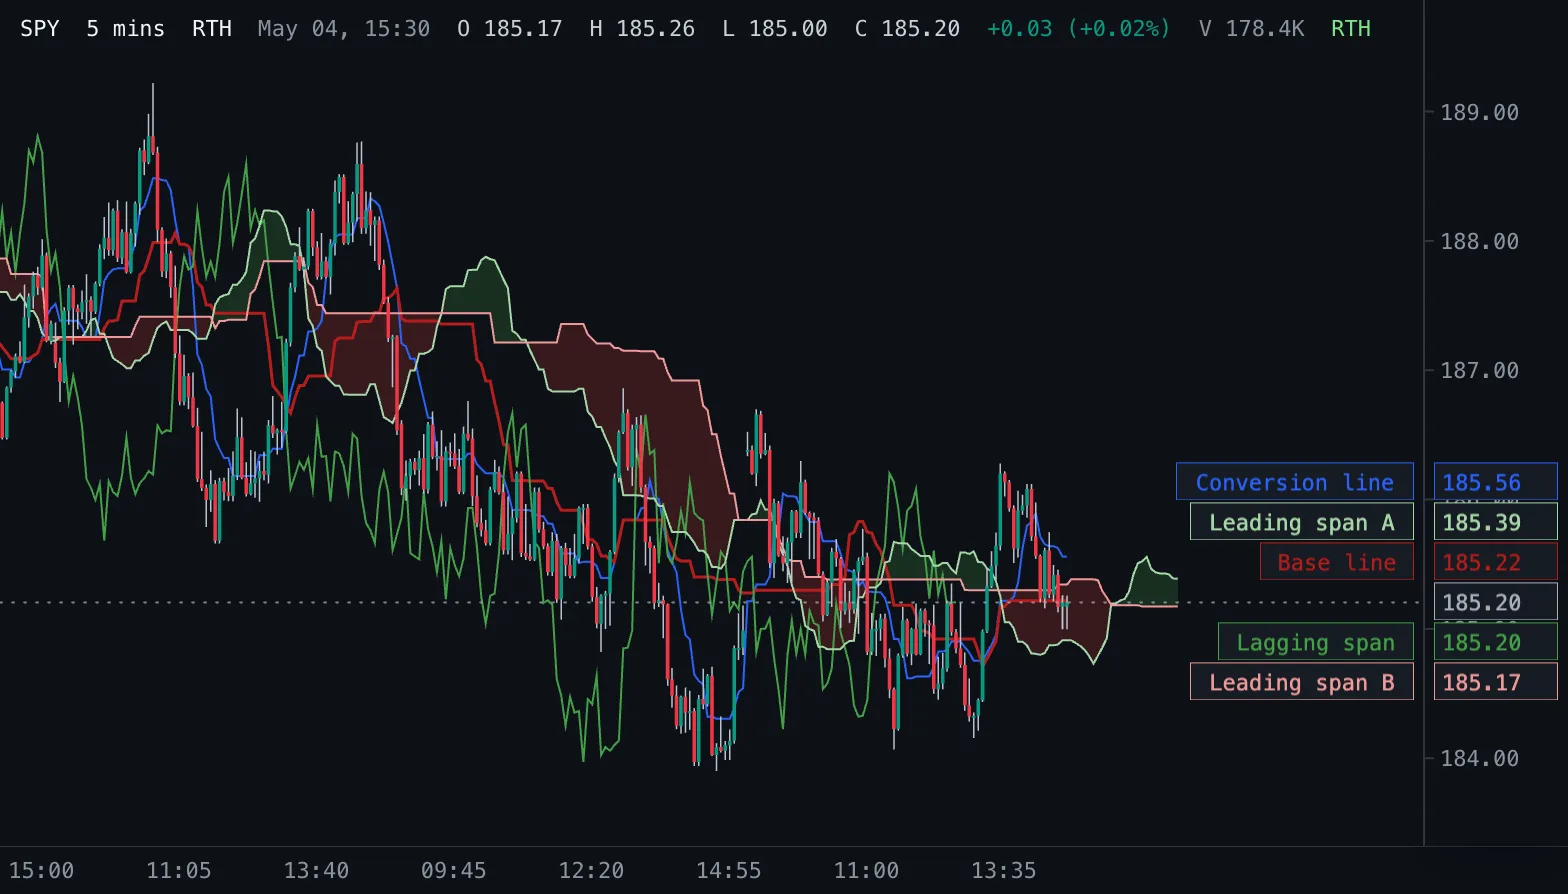
Ichimoku Cloud Ichimoku
Ichimoku Kinko Hyo: conversion and base lines, a cloud of two leading spans projected into the future, and the lagging close.