52-Week High/Low
The highest high and lowest low of the last 52 weeks as levels, read from real daily bars.
- 52W H/L
- Built into Spectral
- Updates every tick
- 52-week high
- 52-week low
- yearly range
- new highs
- breakout
- higher timeframe
MIT-0: free to use, change and share, no attribution needed. What you build from it is yours.
Already in Spectral: add it from the Indicators toolbox. The file here is the same indicator written as a custom indicator, to change or learn from. Installed, it appears next to the built-in one, marked Custom.
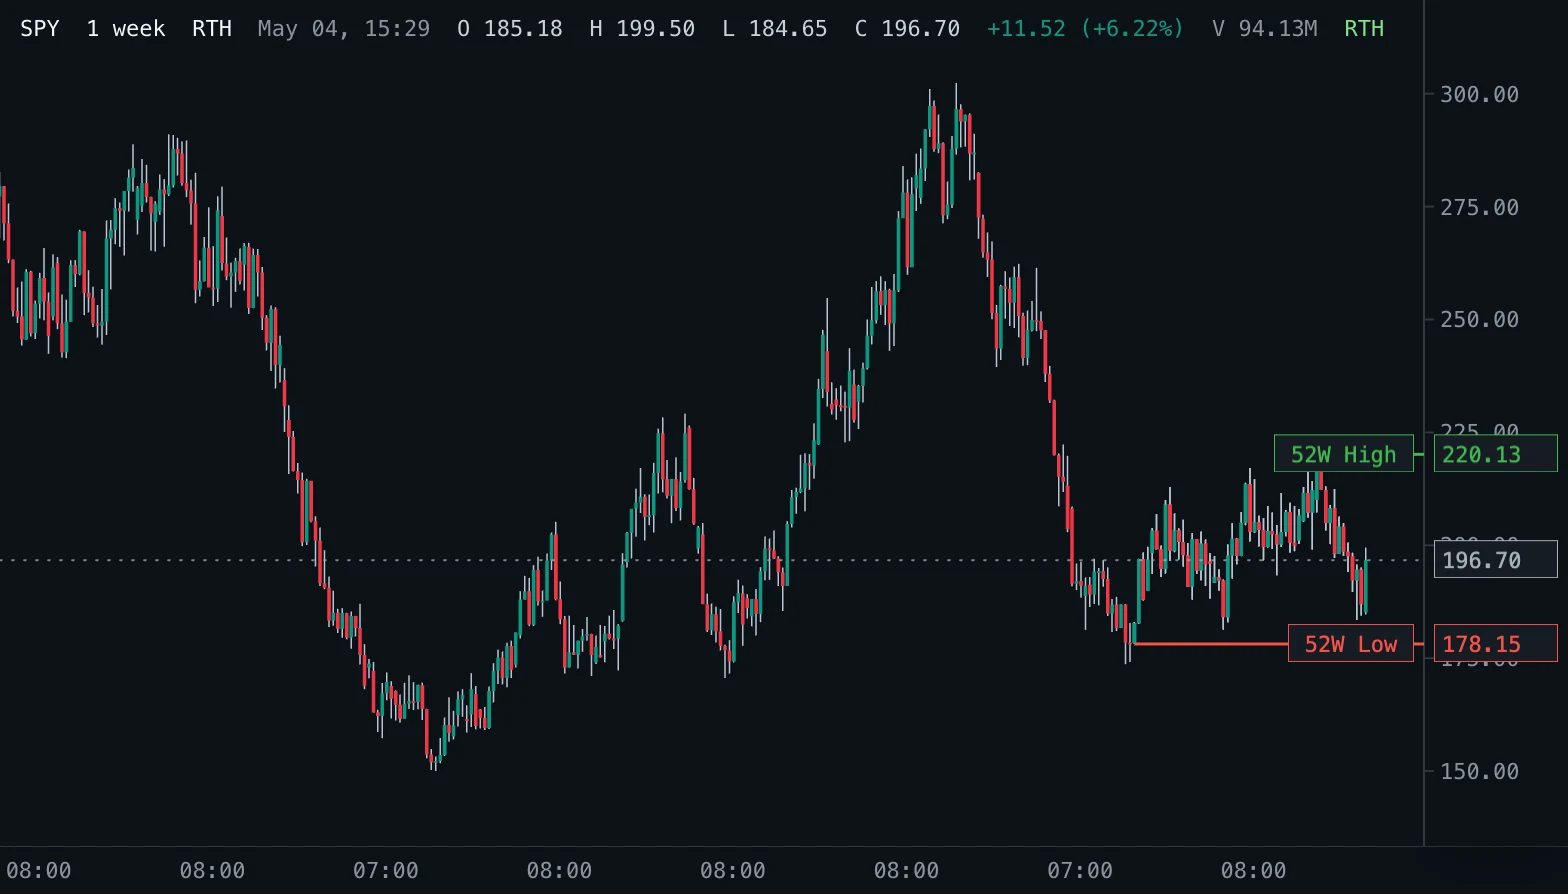
Overview
52-Week High/Low draws the highest high and the lowest low the symbol has traded at over the last year, the range quoted on every stock page and scanned for in new-high and new-low lists. The values come from real daily regular-trading-hours bars that Spectral loads beside the chart, so they are correct on any bar size, even when the chart has loaded only a few days.
Each level starts at the chart bar of the day the extreme was set, or spans the whole chart when that day is older than the loaded chart history.
How to read it
Price near the 52-week high is at the top of a year of trading: many traders buy breakouts to new highs, because there is no overhead supply from holders at a loss, while others watch for a failed break. The 52-week low is the mirror image. A stock that keeps setting new highs (or lows) is in a strong long-term trend.
The midpoint splits the range; price above it is in the upper half of the year. The levels are references, not signals.
Settings and limitations
52-week high, 52-week low and Midpoint switch each level; the midpoint is off by default.
The 52 weeks end at the trading date of the chart's last bar and include it, so the current day's high and low count as soon as they print and update live. Values use regular trading hours (09:30 to 16:00 New York time, to 13:00 on early-close days), like the 52-week range most quote pages show; pre-market and after-hours prices are not included.
Notes
The window is one calendar year: every daily bar after the same date a year earlier, up to the chart's last trading date. Some data vendors use closing prices or include extended hours, so their 52-week range can differ slightly.
A symbol that has traded for less than a year (a recent listing) has no full 52 weeks: the built-in in Spectral then draws the range since its first trading day, which is exact for the history that exists, and its status says since when. A copy imported as your own file waits for a full year instead.
Settings
Each setting appears in the indicator's settings panel in Spectral, next to a color setting for every output.
| Setting | Type | Default | Range or options | What it does |
|---|---|---|---|---|
| 52-week high | On / off | On | — | Draw the highest regular-session high of the last 52 weeks. |
| 52-week low | On / off | On | — | Draw the lowest regular-session low of the last 52 weeks. |
| Midpoint | On / off | Off | — | Draw the middle of the 52-week range. |
What it draws
Levels
- 52W Highsolid · 1.5 px · value on the axis
#3FB950 - 52W Lowsolid · 1.5 px · value on the axis
#F85149 - 52W Middashed · 1 px · value on the axis
#8B949E
Source
Save it as fifty-two-week-high-low.js and add it with Indicators → Custom indicators → Add file…. The format is explained in the custom indicators guide.
// Copyright (c) 2026 Spectral
// SPDX-License-Identifier: MIT-0
// Free to use, copy, modify and share: https://spectral.trade/docs/custom-indicators/LICENSE.txt
/** @type {import('./spectral-indicator').IndicatorV2} */
export default {
  schemaVersion: 2,
  id: 'fifty-two-week-high-low',
  name: '52-Week High/Low',
  shortName: '52W H/L',
  version: '1.0.1',
  author: 'Spectral',
  description: 'The highest high and lowest low of the last 52 weeks as levels, read from real daily bars.',
  pane: 'price',
  live: { lookback: 0 },
  inputs: {
    showHigh: { type: 'boolean', label: '52-week high', default: true, description: 'Draw the highest regular-session high of the last 52 weeks.' },
    showLow: { type: 'boolean', label: '52-week low', default: true, description: 'Draw the lowest regular-session low of the last 52 weeks.' },
    showMid: { type: 'boolean', label: 'Midpoint', default: false, description: 'Draw the middle of the 52-week range.' },
  },
  levels: {
    high: { label: '52W High', color: '#3FB950', lineWidth: 1.5, lineStyle: 'solid', showValue: true },
    low: { label: '52W Low', color: '#F85149', lineWidth: 1.5, lineStyle: 'solid', showValue: true },
    mid: { label: '52W Mid', color: '#8B949E', lineStyle: 'dashed', showValue: true },
  },
  auxiliary: {
    daily: { barSize: '1 day', duration: '1 Y', useRth: true, keepUpToDate: true },
  },
  docs: {
    overview: '52-Week High/Low draws the highest high and the lowest low the symbol has traded at over the last year, the range quoted on every stock page and scanned for in new-high and new-low lists. The values come from real daily regular-trading-hours bars that Spectral loads beside the chart, so they are correct on any bar size, even when the chart has loaded only a few days.\n\nEach level starts at the chart bar of the day the extreme was set, or spans the whole chart when that day is older than the loaded chart history.',
    howToRead: 'Price near the 52-week high is at the top of a year of trading: many traders buy breakouts to new highs, because there is no overhead supply from holders at a loss, while others watch for a failed break. The 52-week low is the mirror image. A stock that keeps setting new highs (or lows) is in a strong long-term trend.\n\nThe midpoint splits the range; price above it is in the upper half of the year. The levels are references, not signals.',
    settings: '52-week high, 52-week low and Midpoint switch each level; the midpoint is off by default.\n\nThe 52 weeks end at the trading date of the chart\'s last bar and include it, so the current day\'s high and low count as soon as they print and update live. Values use regular trading hours (09:30 to 16:00 New York time, to 13:00 on early-close days), like the 52-week range most quote pages show; pre-market and after-hours prices are not included.',
    notes: 'The window is one calendar year: every daily bar after the same date a year earlier, up to the chart\'s last trading date. Some data vendors use closing prices or include extended hours, so their 52-week range can differ slightly.\n\nA symbol that has traded for less than a year (a recent listing) has no full 52 weeks: the built-in in Spectral then draws the range since its first trading day, which is exact for the history that exists, and its status says since when. A copy imported as your own file waits for a full year instead.',
  },
  calculate(ctx) {
    const { bars, inputs, time, auxiliary } = ctx;
    const levels = { high: null, low: null, mid: null };
    const lastIndex = bars.length - 1;
    if (lastIndex < 0) return { levels };
    const lastDate = time.ny(bars[lastIndex]).dateKey;
    const yearEarlier = `${Number(lastDate.slice(0, 4)) - 1}${lastDate.slice(4)}`;

    let high = null;
    let low = null;
    for (const bar of auxiliary.daily) {
      const date = time.ny(bar).dateKey;
      if (date <= yearEarlier || date > lastDate) continue;
      if (high === null || bar.high > high.price) high = { price: bar.high, from: time.dayStart(bar) };
      if (low === null || bar.low < low.price) low = { price: bar.low, from: time.dayStart(bar) };
    }
    if (high === null || low === null) return { levels };

    // Each level starts at the first chart bar of the day its extreme was set (the left edge when that day is older).
    if (inputs.showHigh) levels.high = { price: high.price, fromTime: high.from };
    if (inputs.showLow) levels.low = { price: low.price, fromTime: low.from };
    if (inputs.showMid) levels.mid = { price: (high.price + low.price) / 2, fromTime: Math.max(high.from, low.from) };
    return { levels };
  },
};
Adapt it with an LLM
Paste this into your assistant and replace the second-to-last line with the change you want.
Start from this Spectral custom indicator: https://spectral.trade/indicators/fifty-two-week-high-low.js
Format reference: https://spectral.trade/docs/custom-indicators.llm.md
Keep the file format and every rule of the reference; give the result a new id, name, shortName and version, and update docs and input descriptions to match.
Keep its live updates exact and fast (section "Fast live updates" of the reference): carry values from bar to bar only through ctx.ta, and raise live.lookback if the change reads further back; Spectral rejects a file whose live updates differ from a full recalculation or are too slow.
Change I want: <describe the change>
Answer with the complete file in one code block, ready to save as <id>.js.
Related indicators
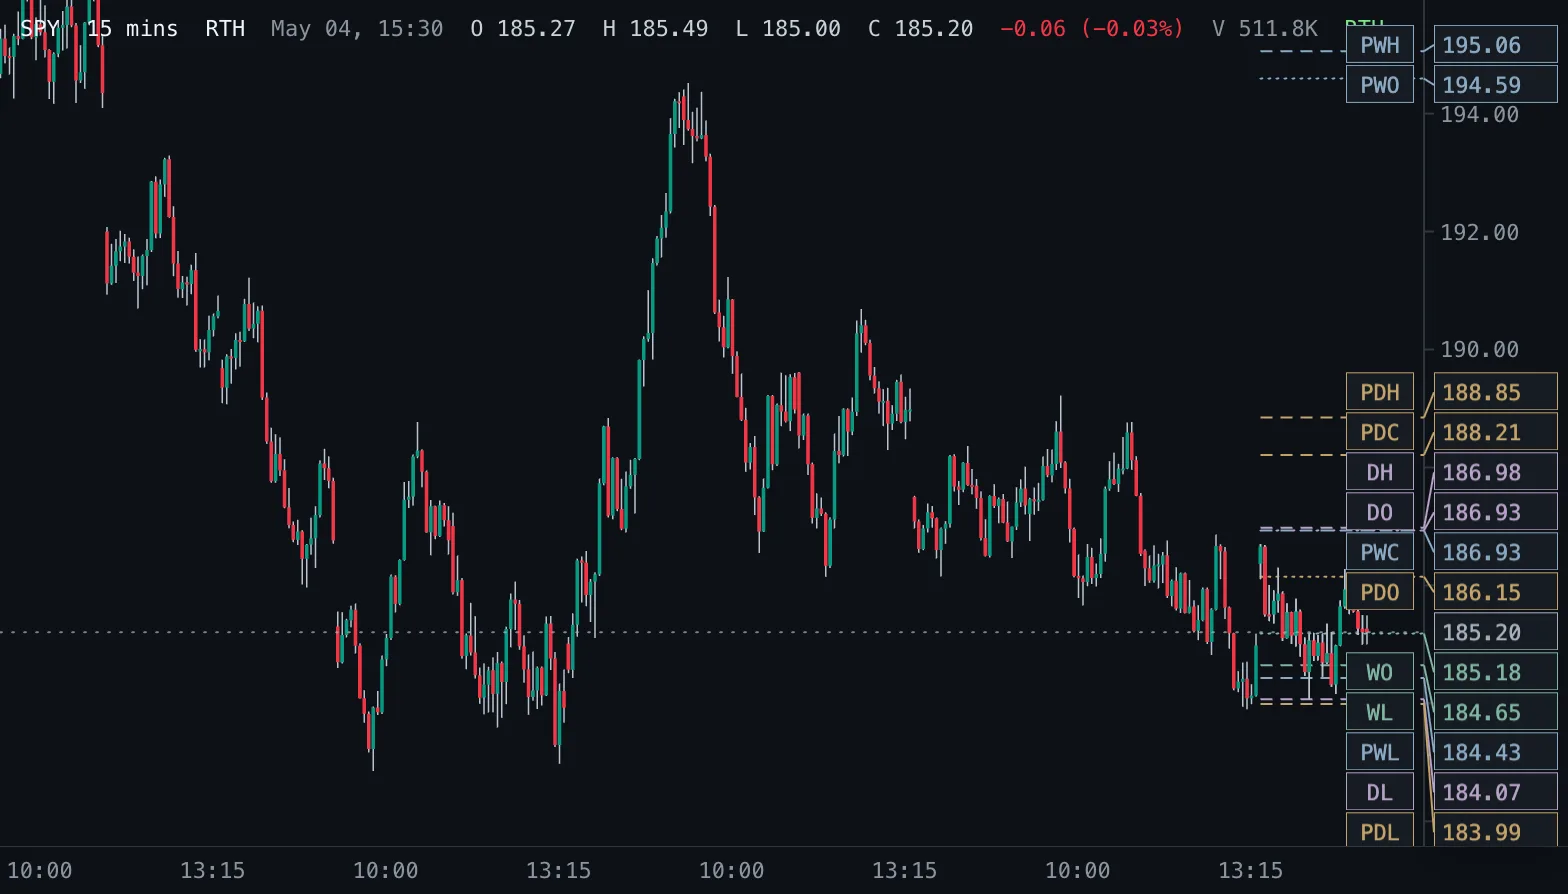
Daily & Weekly Levels D/W Levels
Previous and current day and week open, high, low and close as levels, read from real daily and weekly bars.
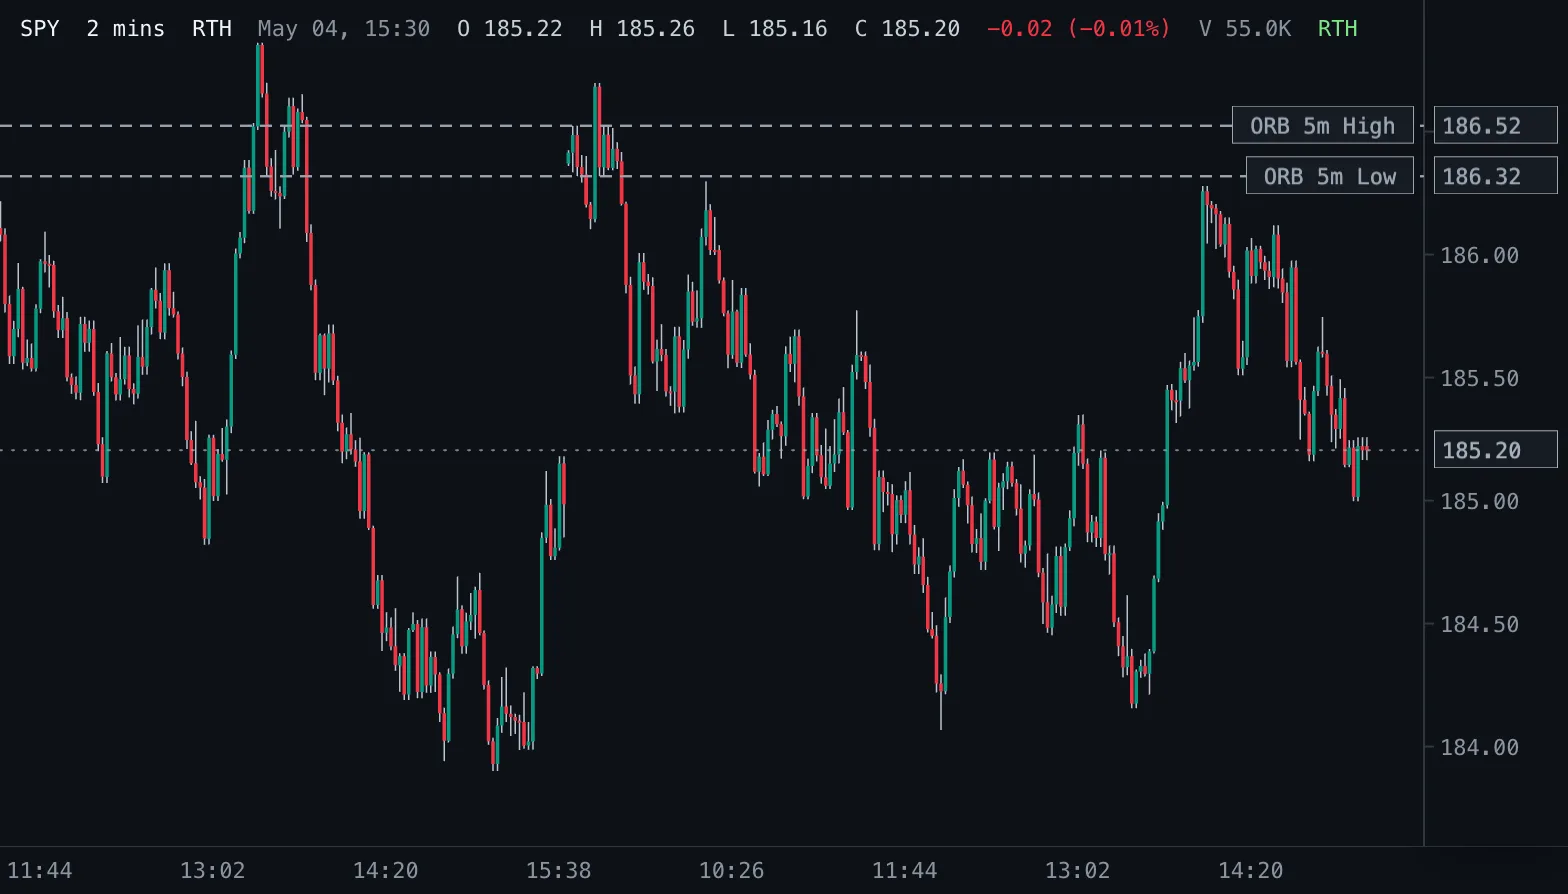
Opening Range Breakout ORB
Opening-range highs and lows for 1, 2, 5, 10, 15, 30 and 60 minutes after the 09:30 New York open.
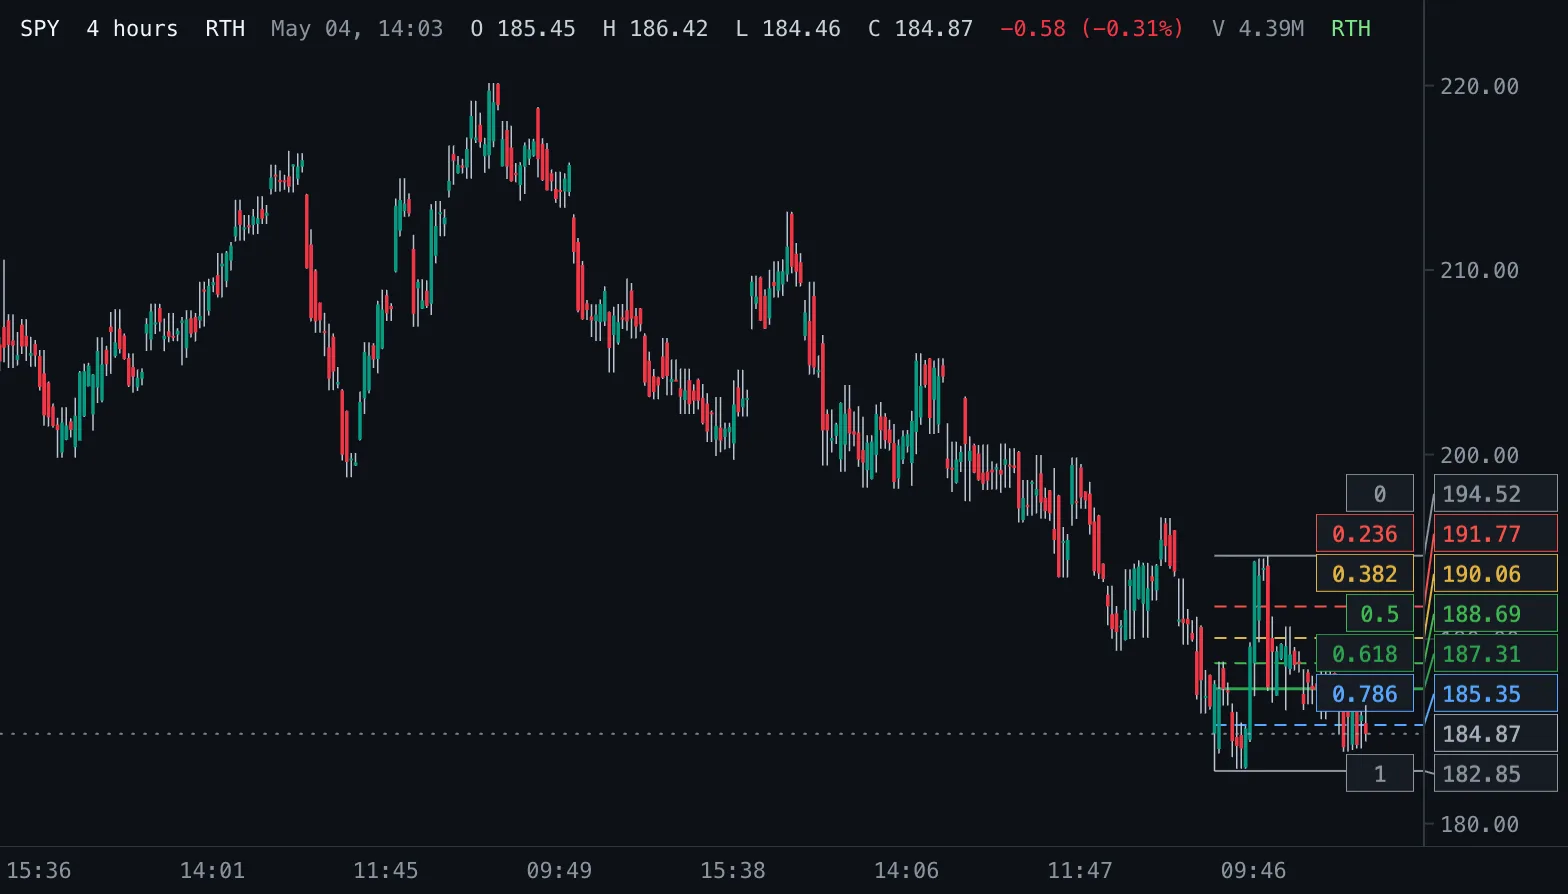
Auto Fib Retracement Auto Fib
Fibonacci retracement levels of the latest confirmed swing, with a swing size that scales with volatility, and optional extensions beyond the swing.