Initial Balance
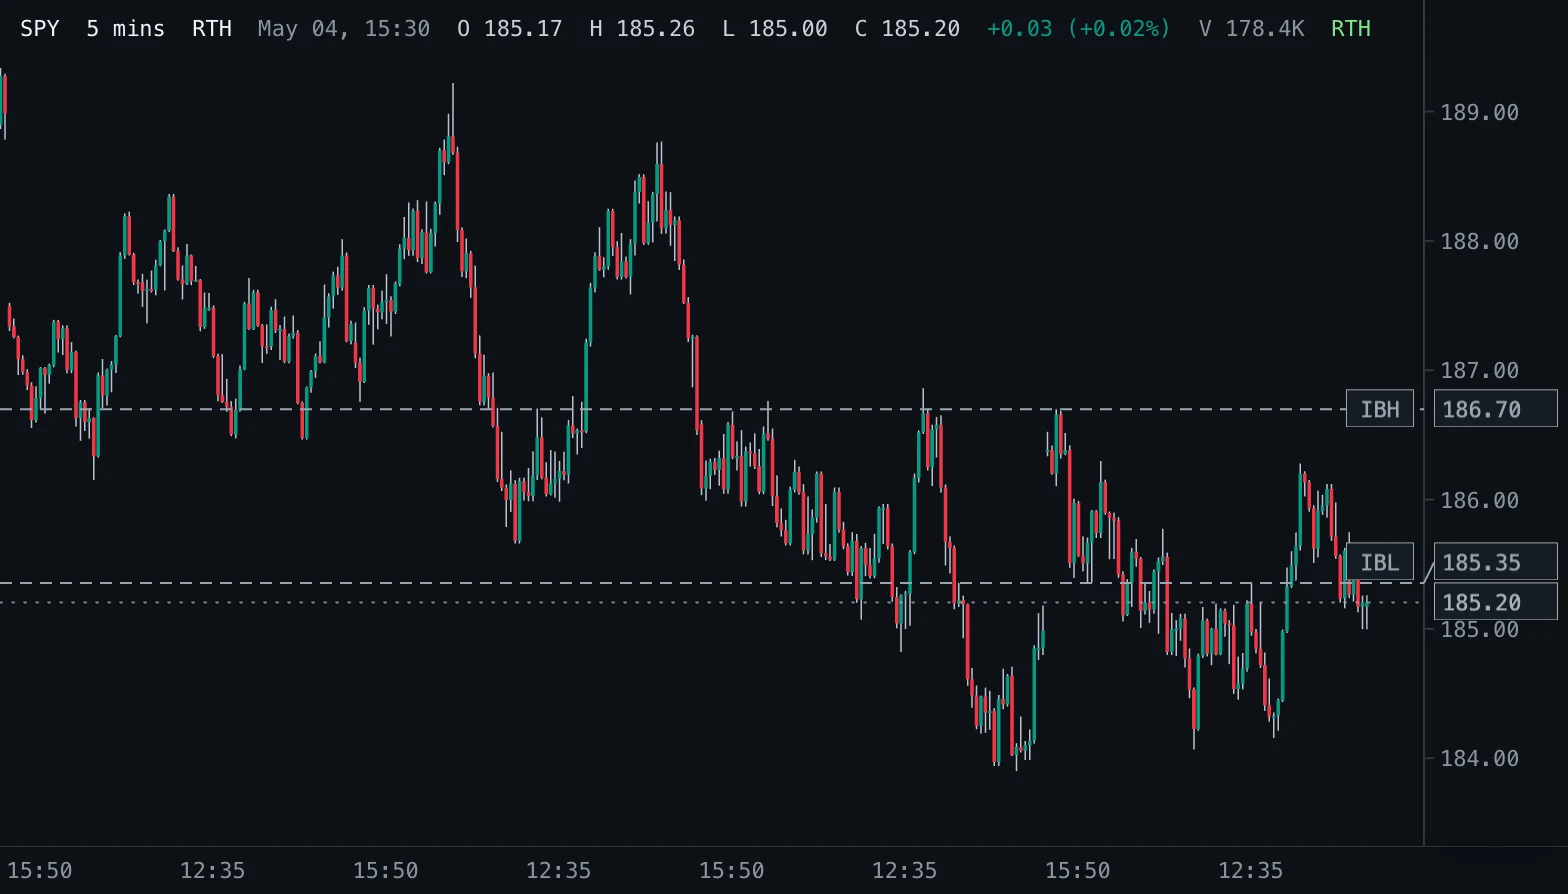
High (IBH) and low (IBL) of the opening period of the New York regular session, drawn once the period completes.
- IB
- Built into Spectral
- Updates every tick
- initial balance
- opening range
- market profile
- session
MIT-0: free to use, change and share, no attribution needed. What you build from it is yours.
Already in Spectral: add it from the Indicators toolbox. The file here is the same indicator written as a custom indicator, to change or learn from. Installed, it appears next to the built-in one, marked Custom.
Overview
Initial Balance records the highest high (IBH) and the lowest low (IBL) of the selected opening period of the latest New York regular session, starting at 09:30. Both levels appear once that period has completed and then stay for the rest of the day.
How to read it
The IB range frames early-session balance. A move outside it can be watched for acceptance, rejection or a return into the range, and the width of the range tells you how volatile the opening was.
Settings and limitations
Choose 15, 30, 45, 60 (default) or 120 minutes. Use a bar size that divides the duration evenly and starts at 09:30, for example 1, 5 or 15 minutes; with larger bars the period cannot be measured exactly.
Notes
Computes the same levels as the built-in Initial Balance in Spectral on 1-minute and other evenly dividing bar sizes. The built-in reads 1-minute bars on every bar size, which a custom indicator cannot do in schema v1. IB does not define breakouts or targets.
Settings
Each setting appears in the indicator's settings panel in Spectral, next to a color setting for every output.
| Setting | Type | Default | Range or options | What it does |
|---|---|---|---|---|
| IB duration | Choice | 60 minutes | 15 minutes, 30 minutes, 45 minutes, 60 minutes, 120 minutes | Opening period measured from 09:30 New York time. |
What it draws
Levels
- IBHdashed · 1 px · value on the axis
#9AA5B1 - IBLdashed · 1 px · value on the axis
#9AA5B1
Source
Save it as initial-balance.js and add it with Indicators → Custom indicators → Add file…. The format is explained in the custom indicators guide.
// Copyright (c) 2026 Spectral
// SPDX-License-Identifier: MIT-0
// Free to use, copy, modify and share: https://spectral.trade/docs/custom-indicators/LICENSE.txt
/** @type {import('./spectral-indicator').IndicatorV1} */
export default {
  schemaVersion: 1,
  id: 'initial-balance',
  name: 'Initial Balance',
  shortName: 'IB',
  version: '1.0.0',
  author: 'Spectral',
  description: 'High (IBH) and low (IBL) of the opening period of the New York regular session, drawn once the period completes.',
  pane: 'price',
  live: { lookback: 0 },
  inputs: {
    duration: { type: 'select', label: 'IB duration', default: '60 minutes', options: ['15 minutes', '30 minutes', '45 minutes', '60 minutes', '120 minutes'], description: 'Opening period measured from 09:30 New York time.' },
  },
  levels: {
    high: { label: 'IBH', color: '#9AA5B1', lineStyle: 'dashed', showValue: true },
    low: { label: 'IBL', color: '#9AA5B1', lineStyle: 'dashed', showValue: true },
  },
  docs: {
    overview: 'Initial Balance records the highest high (IBH) and the lowest low (IBL) of the selected opening period of the latest New York regular session, starting at 09:30. Both levels appear once that period has completed and then stay for the rest of the day.',
    howToRead: 'The IB range frames early-session balance. A move outside it can be watched for acceptance, rejection or a return into the range, and the width of the range tells you how volatile the opening was.',
    settings: 'Choose 15, 30, 45, 60 (default) or 120 minutes. Use a bar size that divides the duration evenly and starts at 09:30, for example 1, 5 or 15 minutes; with larger bars the period cannot be measured exactly.',
    notes: 'Computes the same levels as the built-in Initial Balance in Spectral on 1-minute and other evenly dividing bar sizes. The built-in reads 1-minute bars on every bar size, which a custom indicator cannot do in schema v1. IB does not define breakouts or targets.',
  },
  calculate(ctx) {
    const { bars, inputs, ta, time } = ctx;
    const OPEN = 9 * 60 + 30;
    const minutes = Number.parseInt(inputs.duration, 10);
    const empty = { levels: { high: null, low: null } };
    if (bars.length === 0 || !Number.isFinite(minutes)) return empty;
    // The day's initial balance carries from bar to bar through ta.scan; a new New York date starts it again.
    const states = ta.scan(bars, { date: '', high: null, low: null }, (state, bar) => {
      const info = time.ny(bar);
      const fresh = info.dateKey !== state.date;
      const range = fresh ? { high: null, low: null } : state;
      const inside = info.minutes >= OPEN && info.minutes < OPEN + minutes;
      // A bar that changes nothing returns the state itself, which ta.scan keeps without copying it.
      if (!fresh && (!inside || (range.high !== null && bar.high <= range.high && bar.low >= range.low))) return state;
      if (!inside) return { date: info.dateKey, high: range.high, low: range.low };
      return {
        date: info.dateKey,
        high: range.high === null ? bar.high : Math.max(range.high, bar.high),
        low: range.low === null ? bar.low : Math.min(range.low, bar.low),
      };
    });
    // Drawn once the initial balance period of the latest day is over.
    if (time.ny(bars[bars.length - 1]).minutes < OPEN + minutes) return empty;
    const last = states[states.length - 1];
    return { levels: { high: last.high, low: last.low } };
  },
};
Adapt it with an LLM
Paste this into your assistant and replace the second-to-last line with the change you want.
Start from this Spectral custom indicator: https://spectral.trade/indicators/initial-balance.js
Format reference: https://spectral.trade/docs/custom-indicators.llm.md
Keep the file format and every rule of the reference; give the result a new id, name, shortName and version, and update docs and input descriptions to match.
Keep its live updates exact and fast (section "Fast live updates" of the reference): carry values from bar to bar only through ctx.ta, and raise live.lookback if the change reads further back; Spectral rejects a file whose live updates differ from a full recalculation or are too slow.
Change I want: <describe the change>
Answer with the complete file in one code block, ready to save as <id>.js.
Related indicators
Daily & Weekly Levels D/W Levels
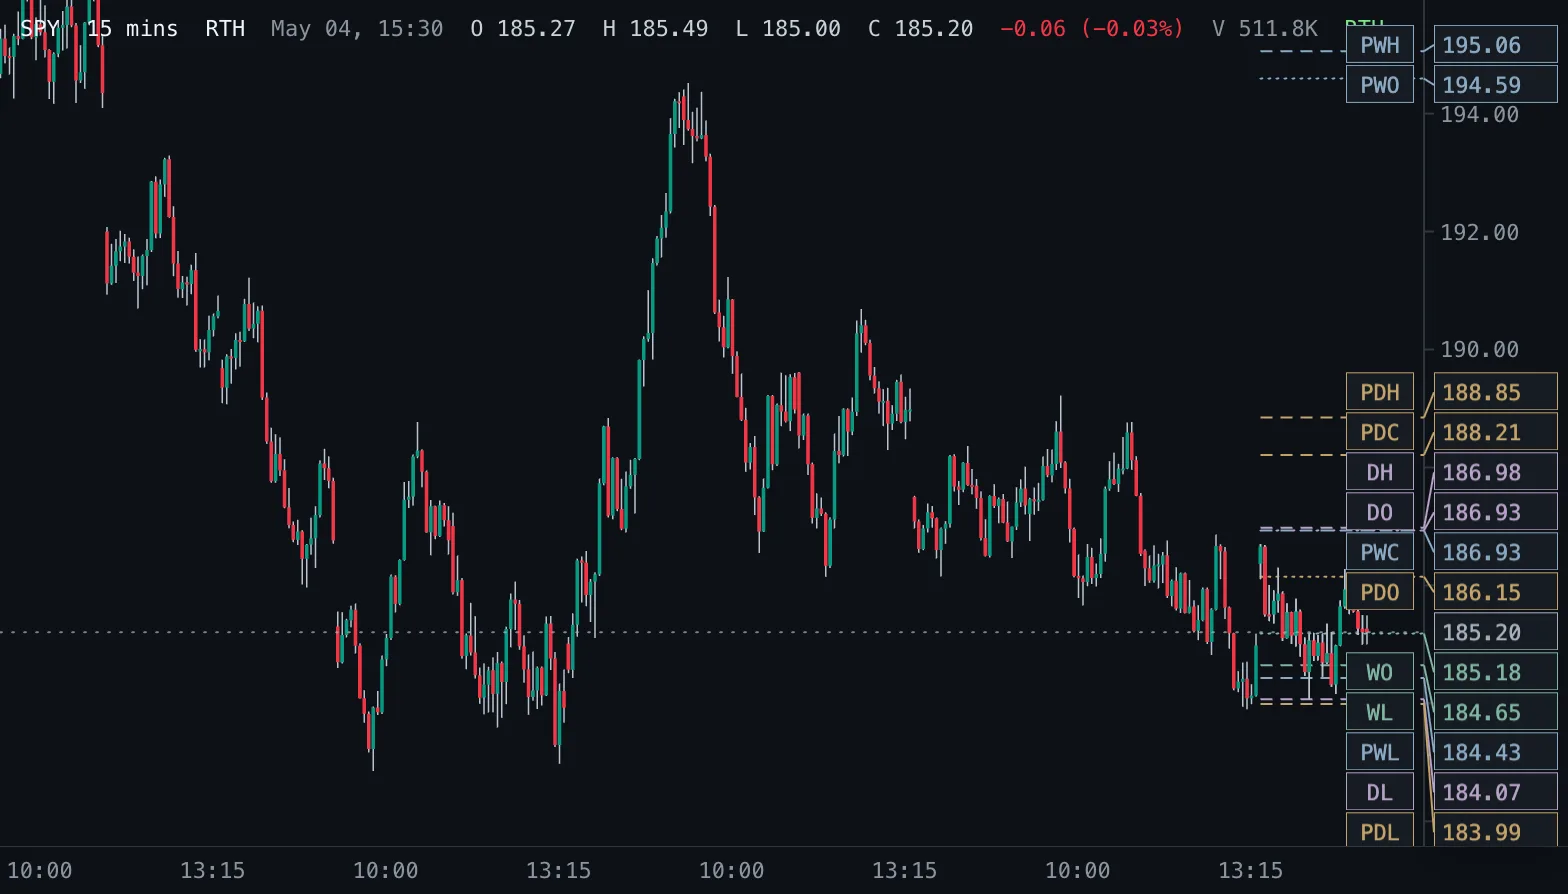
Previous and current day and week open, high, low and close as levels, read from real daily and weekly bars.
Opening Range Breakout ORB
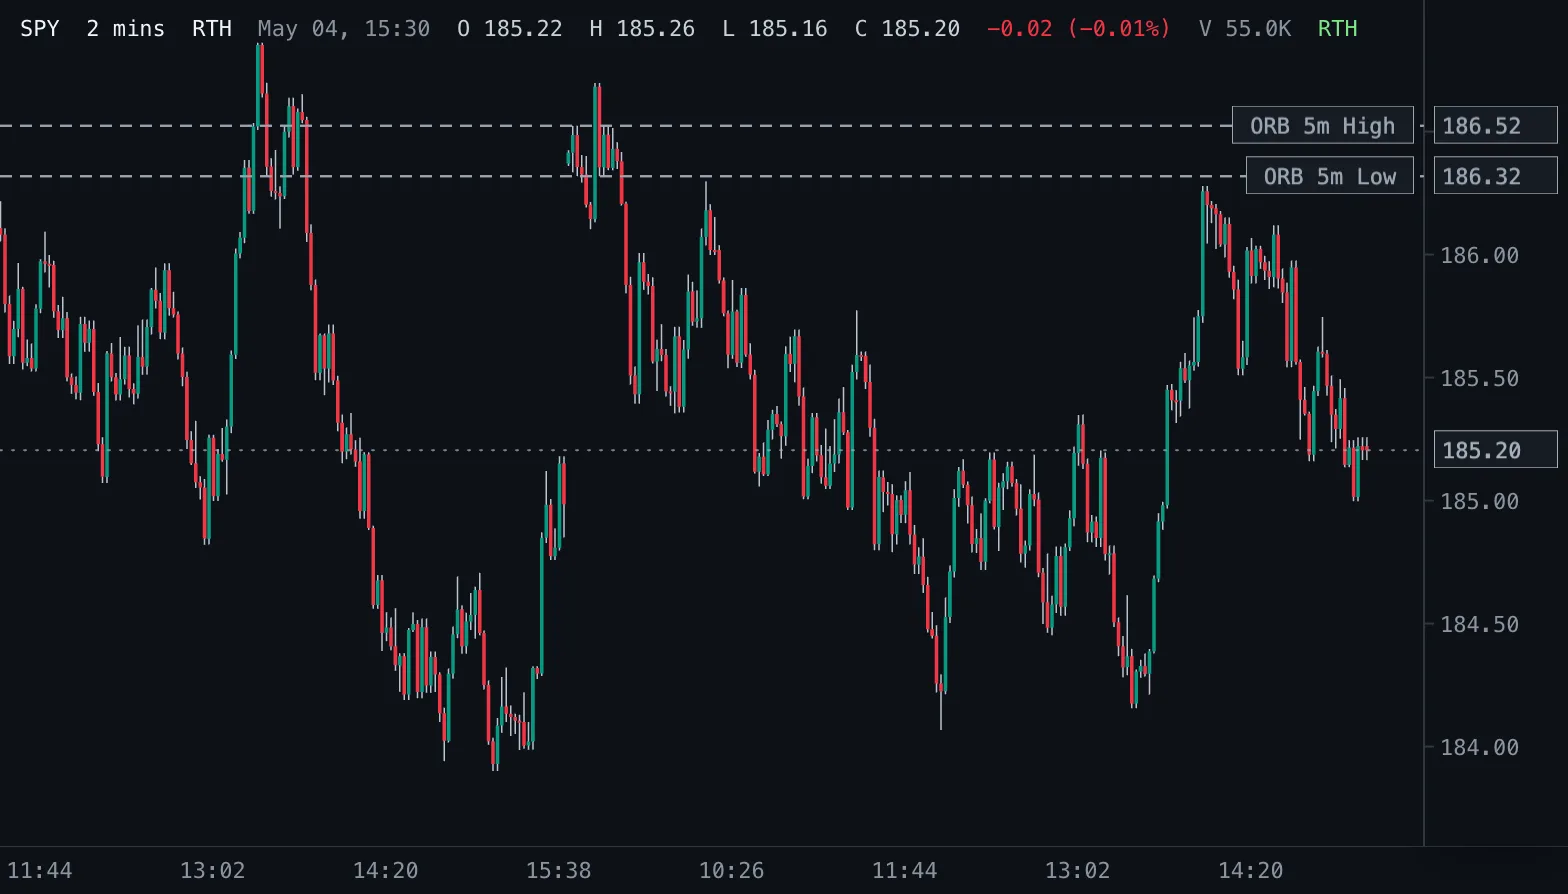
Opening-range highs and lows for 1, 2, 5, 10, 15, 30 and 60 minutes after the 09:30 New York open.
52-Week High/Low 52W H/L
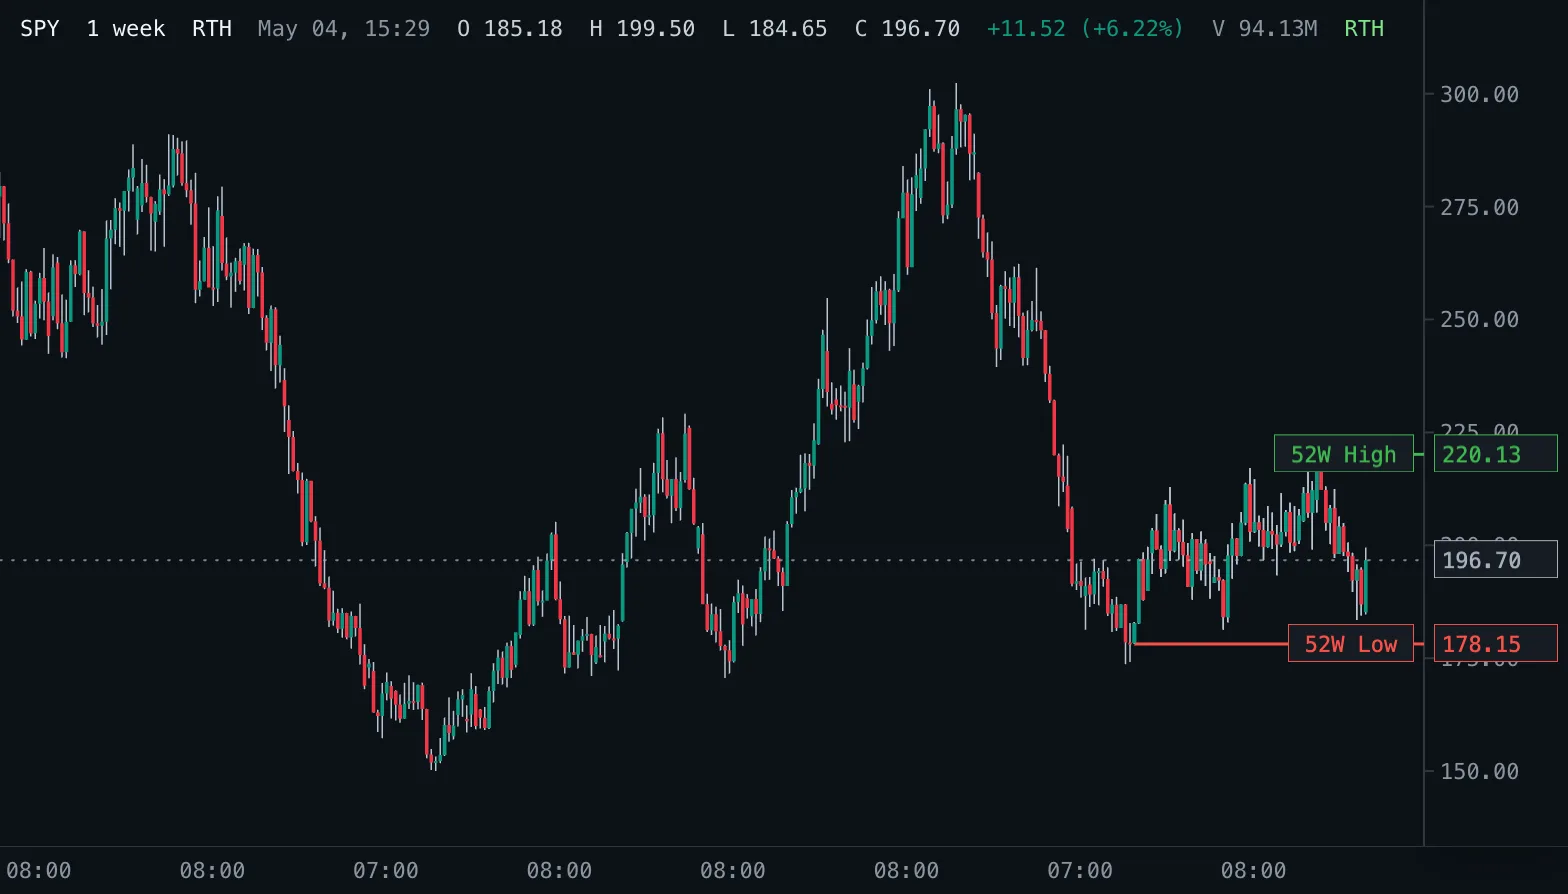
The highest high and lowest low of the last 52 weeks as levels, read from real daily bars.