Keltner Channel Trend Shading
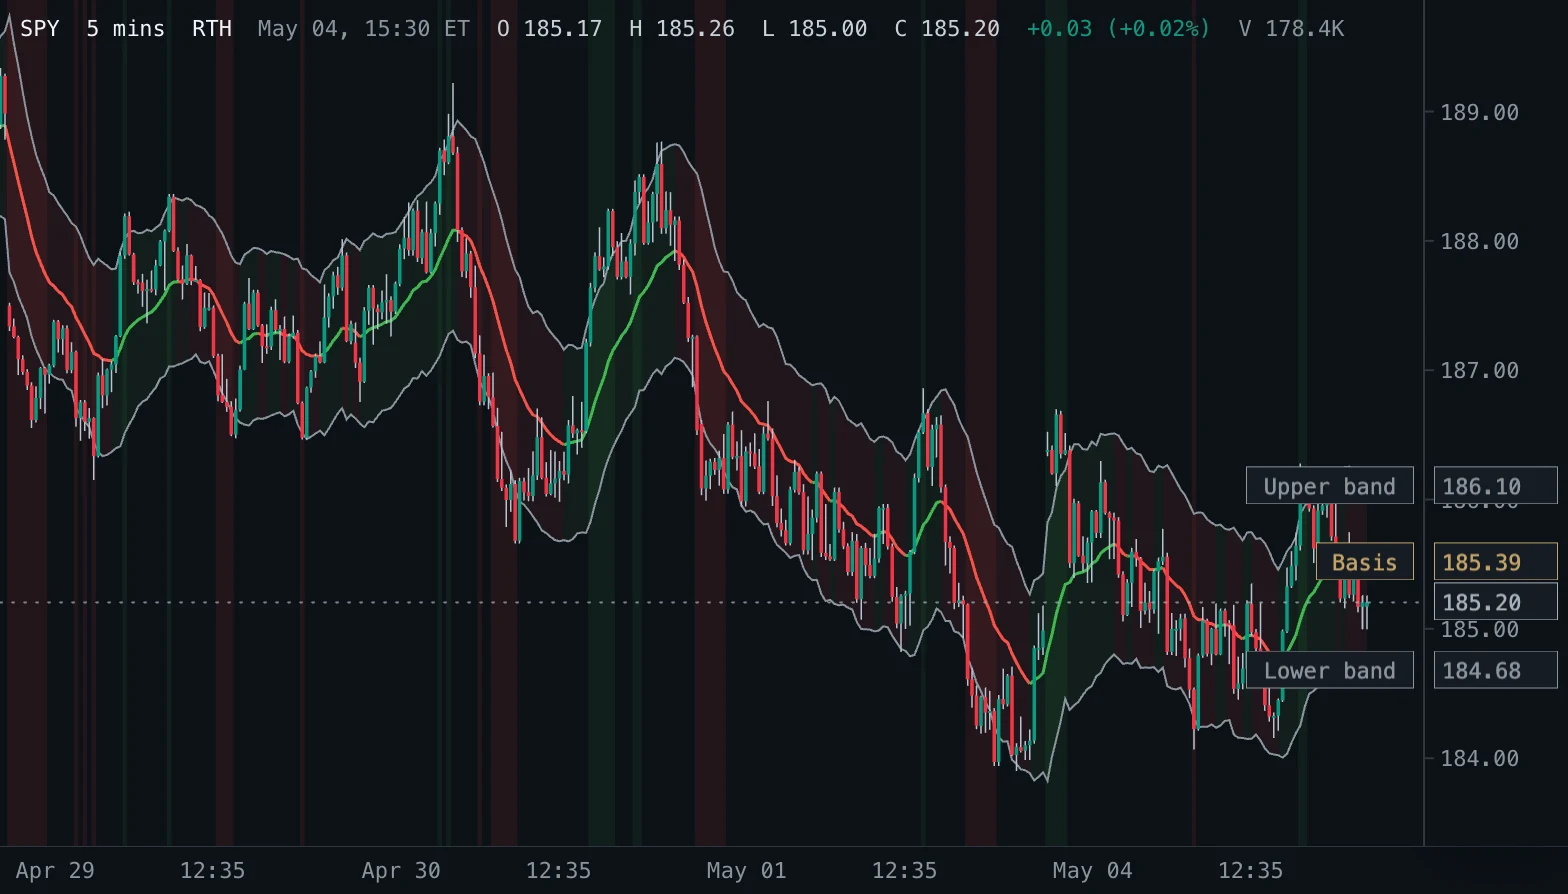
Keltner Channels (EMA 20 +/- 2 ATR 10) with the basis and channel coloured by the direction of the EMA and the pane shaded where a bar closes outside the bands.
- KC Trend
- Updates every tick
- keltner
- channel
- atr
- ema
- trend
- breakout
MIT-0: free to use, change and share, no attribution needed. What you build from it is yours.
Overview
Keltner Channels in Linda Bradford Raschke's ATR form: an EMA of the close as the basis, with bands a multiple of the Average True Range above and below it (EMA 20 +/- 2 x ATR 10 by default). The basis and the channel fill turn green while the EMA rises and red while it falls, and the pane is shaded on every bar that closes outside the bands.
How to read it
The colour of the channel is the direction of the trend the EMA follows. A close above the upper band (green shading) is a strong move up, a close below the lower band (red shading) a strong move down: in a trend of the same colour they show strength and continuation, against it an overextended move that often returns into the channel. Narrow bands mean low volatility, wide bands high volatility.
Settings and limitations
EMA length sets the basis, ATR length and ATR multiplier the width of the bands (the squeeze preset of many traders is 1.5). Shade closes outside switches the shading. The trend colours, the shading colours and its opacity are appearance settings.
Notes
Formulas (StockCharts ChartSchool, Keltner Channels): middle line = EMA(20) of the close, upper = EMA + 2 x ATR(10), lower = EMA - 2 x ATR(10), with the ATR a Wilder average of the true range seeded with the plain average of the first 10 values; Chester Keltner's 1960 original used a 10-day average of the typical price and range instead. The EMA starts at the first close. The basis counts as rising when it is at or above the previous bar's basis. Same bands as the built-in Keltner Channels with its default settings.
Settings
Each setting appears in the indicator's settings panel in Spectral, next to a color setting for every output.
| Setting | Type | Default | Range or options | What it does |
|---|---|---|---|---|
| EMA length | Whole number | 20 | 1 – 500 | Bars in the EMA of the close that forms the basis. |
| ATR multiplier | Number | 2 | 0.1 – 10, step 0.1 | Distance of each band from the basis, in multiples of the Average True Range. |
| ATR length | Whole number | 10 | 1 – 500 | Bars in the Average True Range (Wilder smoothing). |
| Shade closes outside | On / off | On | — | Shade the bars that close above the upper band or below the lower band. |
What it draws
Lines
- Basissolid · 1.5 px · primary · colored per bar from Trend (2 colors)
#C4A46A #3FB950 #F85149 - Upper bandsolid · 1 px
#8B949E - Lower bandsolid · 1 px
#8B949E
Zones
- Channel fillfilled at 8% opacity · colored per bar from Trend (2 colors)
#8B949E #3FB950 #F85149
Background shadings
- Close outside the bandsbackground per bar from Close outside (2 colors) · at 10% opacity
#2EA043 #DA3633
Source
Save it as keltner-trend-shading.js and add it with Indicators → Custom indicators → Add file…. The format is explained in the custom indicators guide.
// Copyright (c) 2026 Spectral
// SPDX-License-Identifier: MIT-0
// Free to use, copy, modify and share: https://spectral.trade/docs/custom-indicators/LICENSE.txt
/** @type {import('./spectral-indicator').IndicatorV3} */
export default {
  schemaVersion: 3,
  id: 'keltner-trend-shading',
  name: 'Keltner Channel Trend Shading',
  shortName: 'KC Trend',
  version: '1.0.0',
  author: 'Spectral',
  description: 'Keltner Channels (EMA 20 +/- 2 ATR 10) with the basis and channel coloured by the direction of the EMA and the pane shaded where a bar closes outside the bands.',
  pane: 'price',
  live: { lookback: 1 },
  inputs: {
    length: { type: 'integer', label: 'EMA length', default: 20, min: 1, max: 500, description: 'Bars in the EMA of the close that forms the basis.' },
    mult: { type: 'number', label: 'ATR multiplier', default: 2, min: 0.1, max: 10, step: 0.1, description: 'Distance of each band from the basis, in multiples of the Average True Range.' },
    atrLength: { type: 'integer', label: 'ATR length', default: 10, min: 1, max: 500, description: 'Bars in the Average True Range (Wilder smoothing).' },
    shadeOutside: { type: 'boolean', label: 'Shade closes outside', default: true, description: 'Shade the bars that close above the upper band or below the lower band.' },
  },
  palettes: {
    trend: { label: 'Trend', colors: ['#3FB950', '#F85149'] },
    outside: { label: 'Close outside', colors: ['#2EA043', '#DA3633'] },
  },
  plots: {
    basis: { label: 'Basis', color: '#C4A46A', lineWidth: 1.5, palette: 'trend', primary: true },
    upper: { label: 'Upper band', color: '#8B949E', lineWidth: 1 },
    lower: { label: 'Lower band', color: '#8B949E', lineWidth: 1 },
  },
  zones: {
    channel: { label: 'Channel fill', color: '#8B949E', opacity: 0.08, palette: 'trend' },
  },
  bgColors: {
    breakout: { label: 'Close outside the bands', palette: 'outside', opacity: 0.1 },
  },
  docs: {
    overview: 'Keltner Channels in Linda Bradford Raschke\'s ATR form: an EMA of the close as the basis, with bands a multiple of the Average True Range above and below it (EMA 20 +/- 2 x ATR 10 by default). The basis and the channel fill turn green while the EMA rises and red while it falls, and the pane is shaded on every bar that closes outside the bands.',
    howToRead: 'The colour of the channel is the direction of the trend the EMA follows. A close above the upper band (green shading) is a strong move up, a close below the lower band (red shading) a strong move down: in a trend of the same colour they show strength and continuation, against it an overextended move that often returns into the channel. Narrow bands mean low volatility, wide bands high volatility.',
    settings: 'EMA length sets the basis, ATR length and ATR multiplier the width of the bands (the squeeze preset of many traders is 1.5). Shade closes outside switches the shading. The trend colours, the shading colours and its opacity are appearance settings.',
    notes: 'Formulas (StockCharts ChartSchool, Keltner Channels): middle line = EMA(20) of the close, upper = EMA + 2 x ATR(10), lower = EMA - 2 x ATR(10), with the ATR a Wilder average of the true range seeded with the plain average of the first 10 values; Chester Keltner\'s 1960 original used a 10-day average of the typical price and range instead. The EMA starts at the first close. The basis counts as rising when it is at or above the previous bar\'s basis. Same bands as the built-in Keltner Channels with its default settings.',
  },
  calculate(ctx) {
    const { bars, inputs, ta } = ctx;
    const close = ta.source(bars, 'close');
    const basis = ta.ema(close, inputs.length);
    const range = ta.atr(bars, inputs.atrLength);
    const upper = basis.map((value, index) => (value === null || range[index] === null ? null : value + inputs.mult * range[index]));
    const lower = basis.map((value, index) => (value === null || range[index] === null ? null : value - inputs.mult * range[index]));
    // 0 rising, 1 falling basis (compared with the previous bar's basis).
    const trend = basis.map((value, index) => (index === 0 || value === null || basis[index - 1] === null ? null : value >= basis[index - 1] ? 0 : 1));
    const breakout = close.map((value, index) => {
      if (!inputs.shadeOutside || upper[index] === null) return null;
      return value > upper[index] ? 0 : value < lower[index] ? 1 : null;
    });
    return {
      plots: { basis, upper, lower },
      zones: { channel: { upper, lower } },
      colors: { basis: trend, channel: trend },
      bgColors: { breakout },
    };
  },
};
Adapt it with an LLM
Paste this into your assistant and replace the second-to-last line with the change you want.
Start from this Spectral custom indicator: https://spectral.trade/indicators/keltner-trend-shading.js
Format reference: https://spectral.trade/docs/custom-indicators.llm.md
Keep the file format and every rule of the reference; give the result a new id, name, shortName and version, and update docs and input descriptions to match.
Keep its live updates exact and fast (section "Fast live updates" of the reference): carry values from bar to bar only through ctx.ta, and raise live.lookback if the change reads further back; Spectral rejects a file whose live updates differ from a full recalculation or are too slow.
Change I want: <describe the change>
Answer with the complete file in one code block, ready to save as <id>.js.
Related indicators
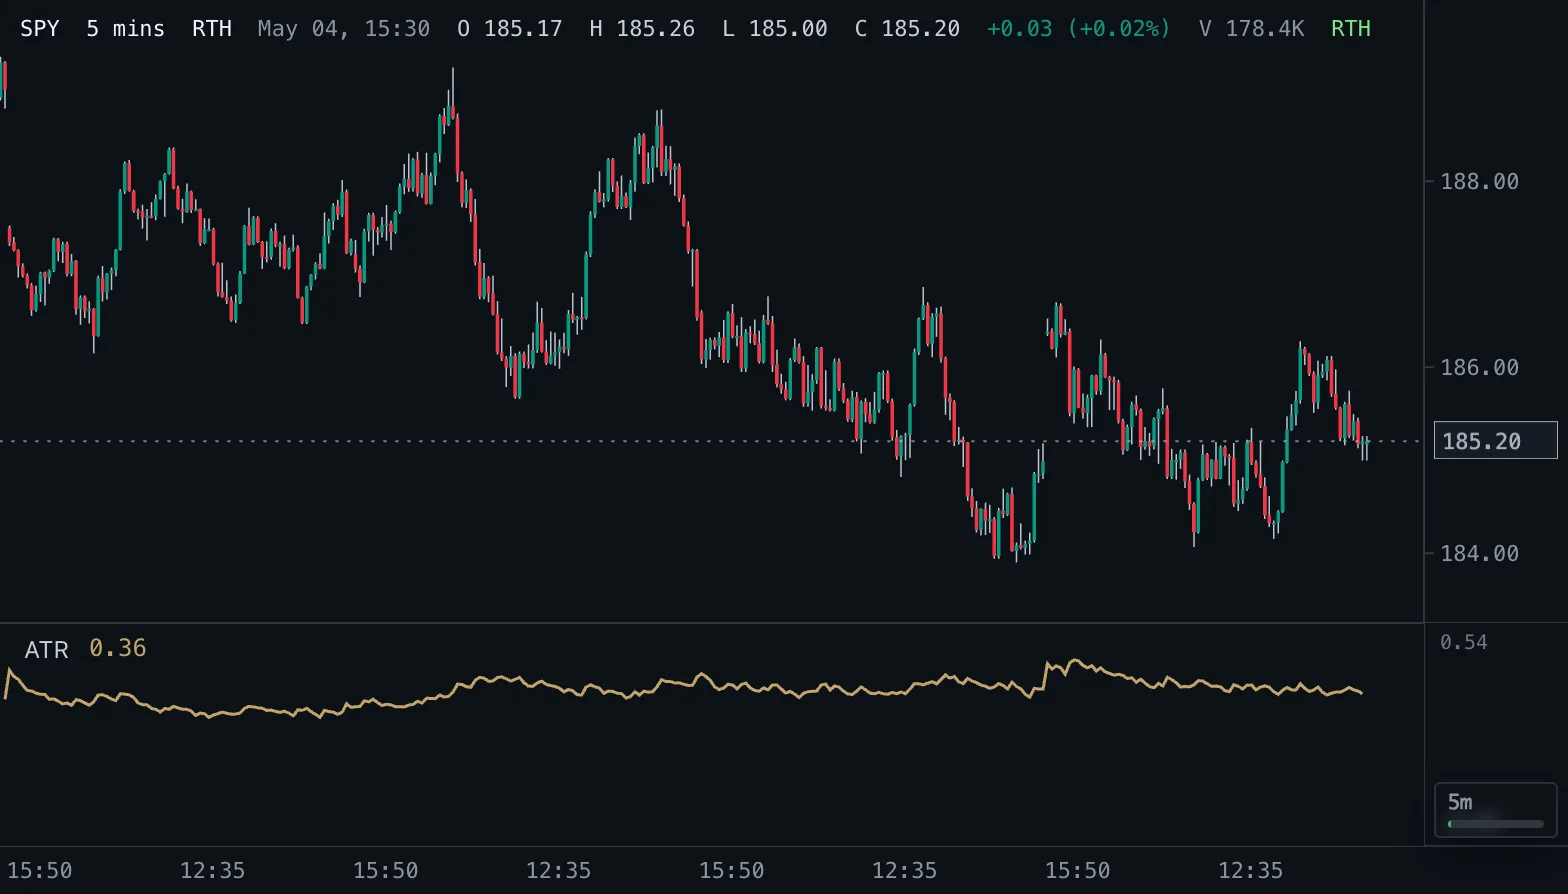
Average True Range ATR
Average True Range: the average size of a bar including gaps, in price units, with Wilder smoothing by default.
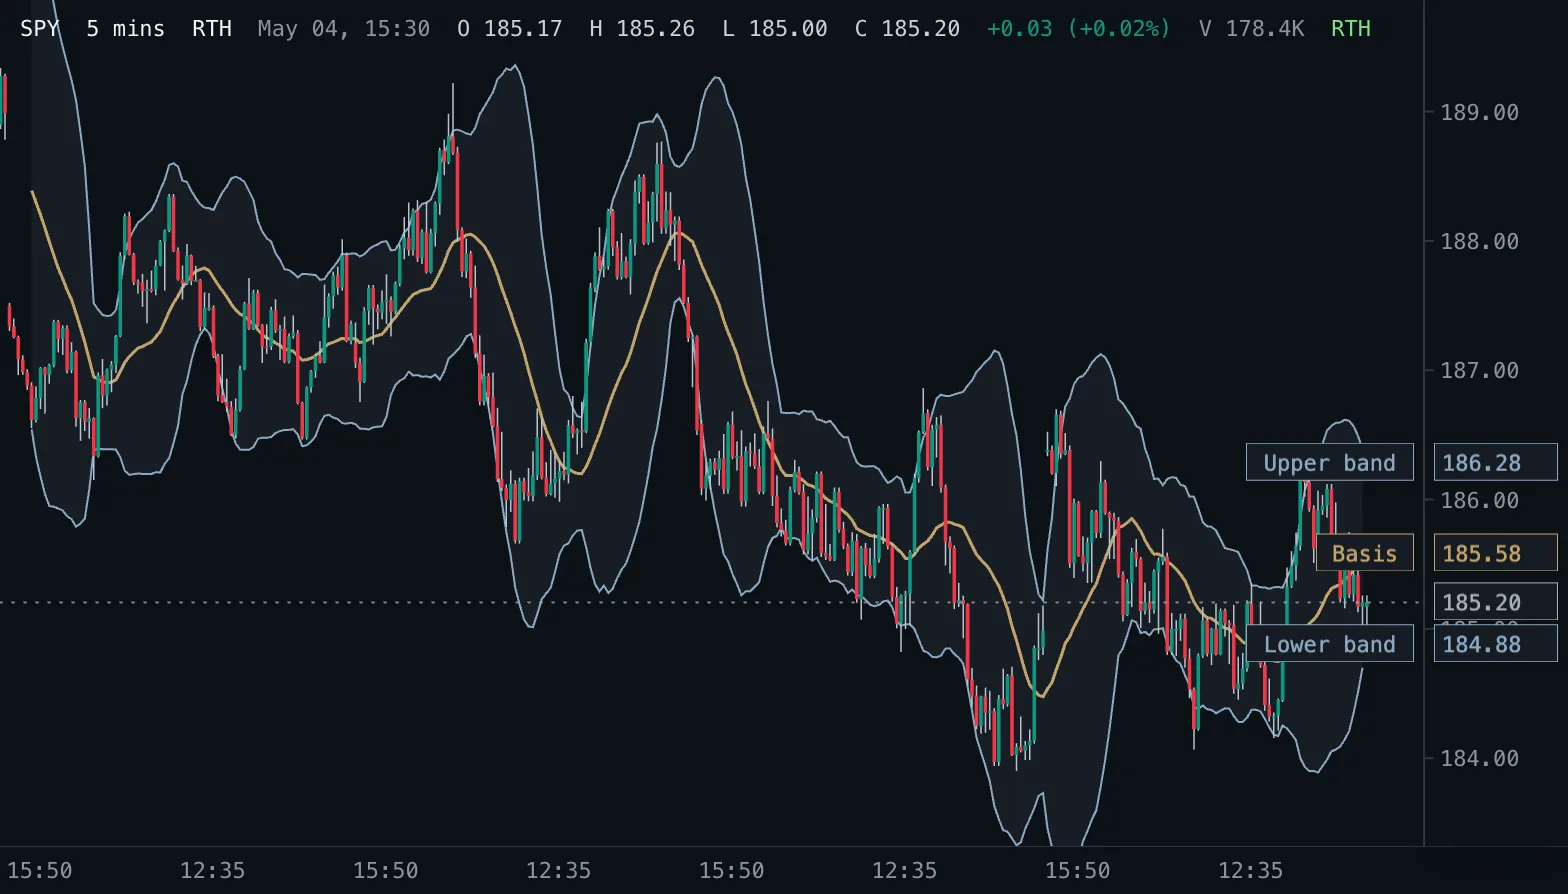
Bollinger Bands BB
A moving average with bands a chosen number of standard deviations above and below it, so the band width follows volatility.
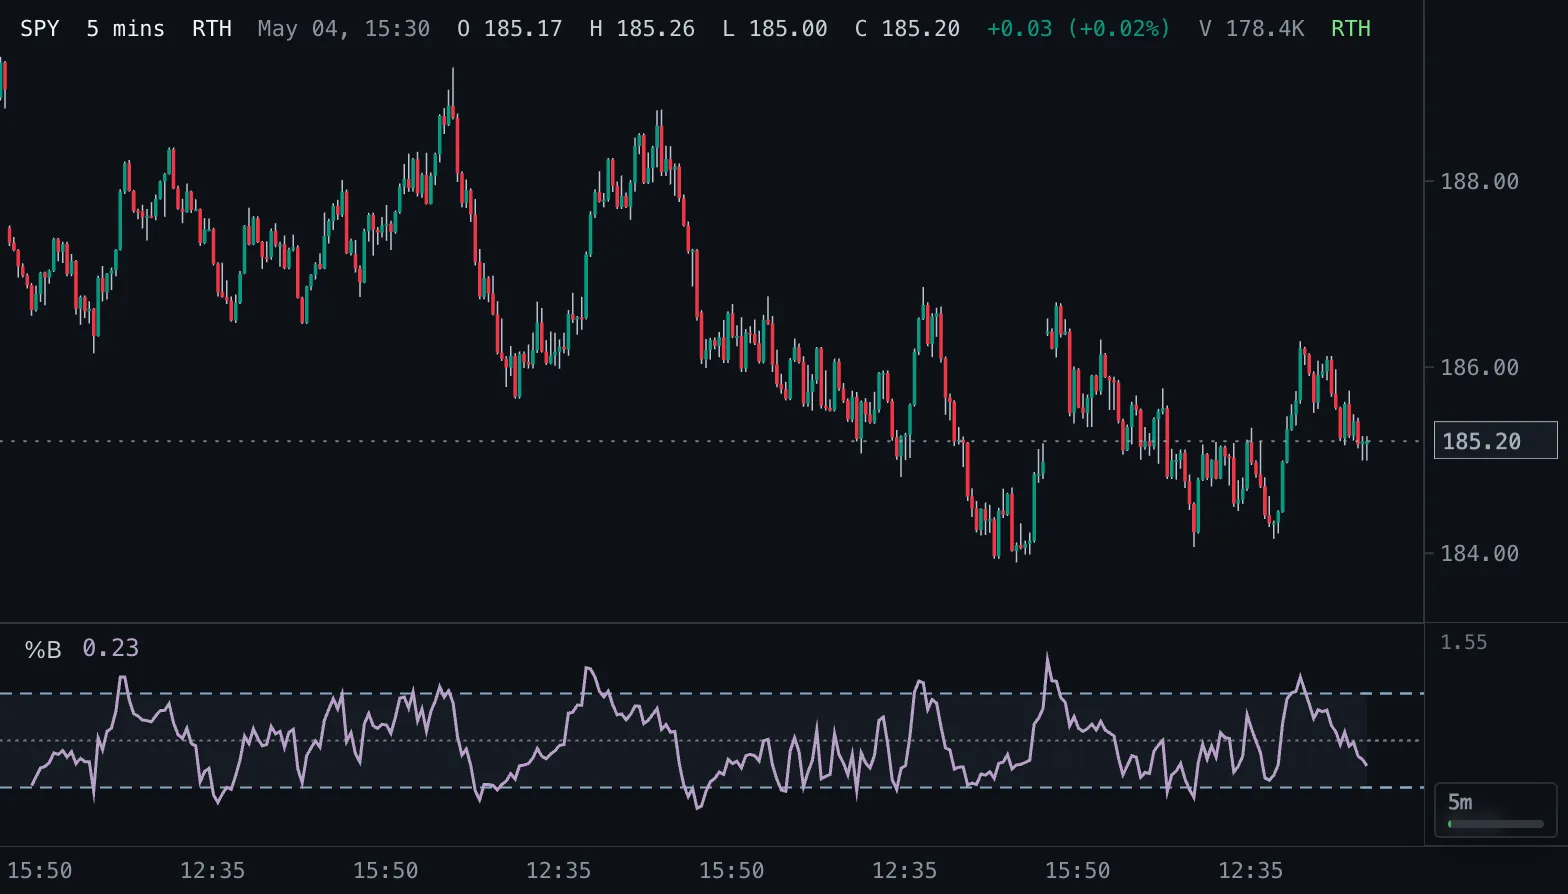
Bollinger %B %B
Where price sits within its Bollinger Bands: 1 at the upper band, 0.5 at the basis, 0 at the lower band.