Williams Fractals Shapes
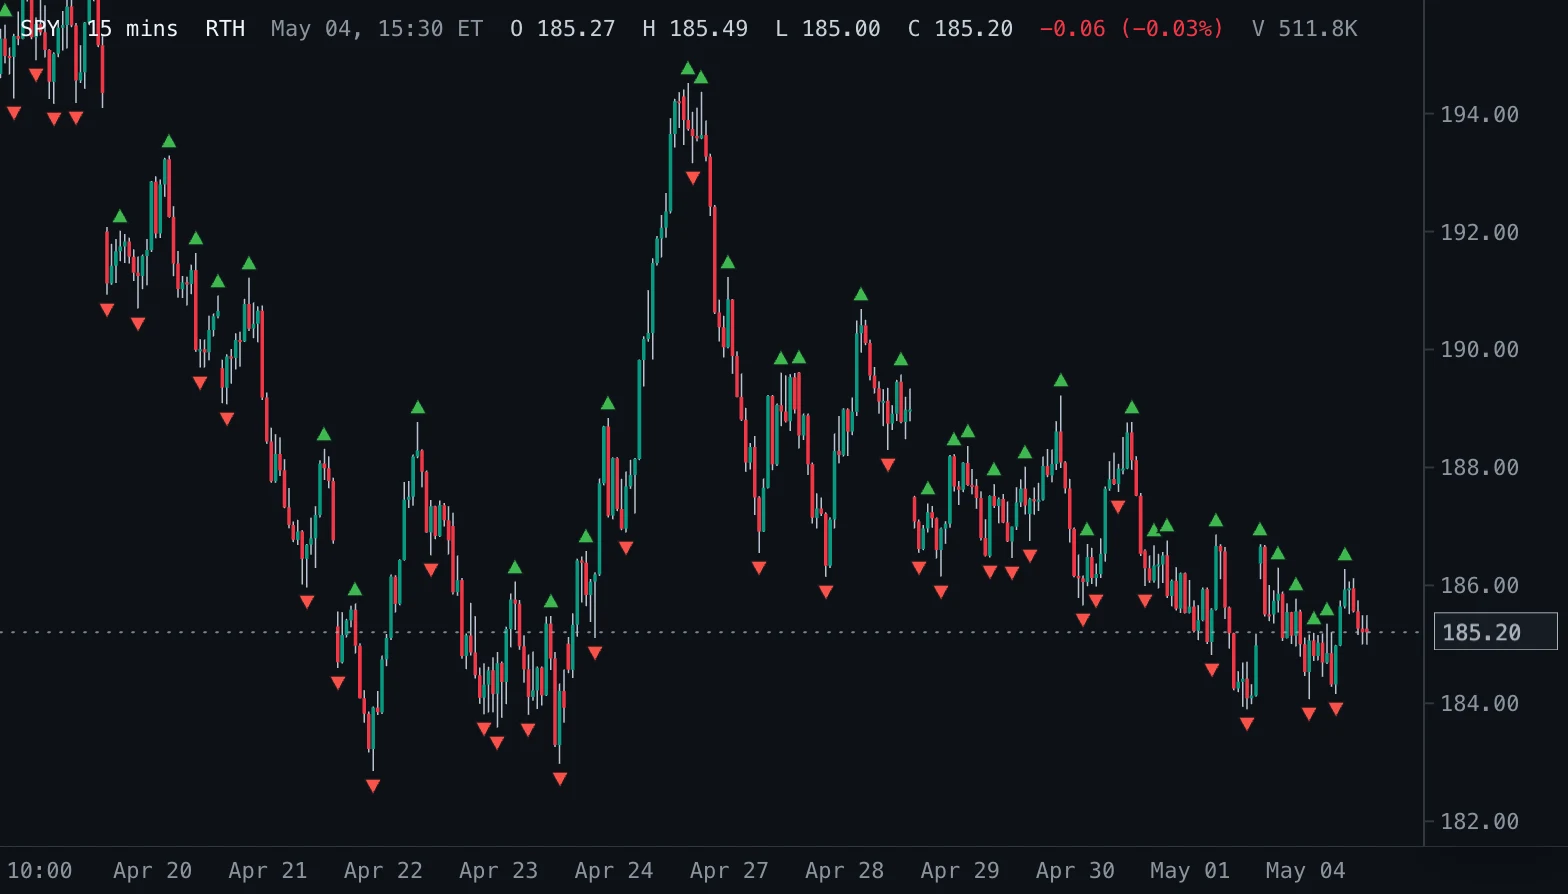
Bill Williams' fractals as triangles: one above every swing-high bar and one below every swing-low bar, hidden while the bars are too narrow to read them.
- Fractals
- Updates at bar close
- williams
- fractals
- swing high
- swing low
- bill williams
- reversal
MIT-0: free to use, change and share, no attribution needed. What you build from it is yours.
Overview
Williams Fractals mark the turning points Bill Williams described in Trading Chaos (1995): an up fractal is a bar whose high is higher than the highs of the two bars before it and the two bars after it, a down fractal a bar whose low is lower than the lows of the two bars on each side. This version draws a triangle above each up fractal and below each down fractal, like TradingView's fractal arrows, and hides them while the bars are narrower than 2 pixels.
How to read it
Up fractals are recent swing highs, down fractals recent swing lows. In Williams' method a break above the latest up fractal is a buy signal and a break below the latest down fractal a sell signal, usually taken only in the direction of the trend. A fractal is known only after the bars on its right have closed, so a triangle appears Periods bars after the bar it marks and never changes afterwards.
Settings and limitations
Periods sets how many bars on each side must be lower (higher for a down fractal); 2 is the classic five-bar pattern, larger values mark fewer, more significant swings with more delay. Up fractals and Down fractals switch each kind; the triangle colours are appearance settings. Zoom in when the triangles are hidden.
Notes
Rule (Bill Williams, Trading Chaos; TradingView, Williams Fractal: five bars, the middle one the highest high or lowest low): strict on both sides here, so a bar whose high equals a neighbour's is no up fractal; the built-in Williams Fractals follows TradingView's script, which also accepts up to four equal highs just before the fractal bar. Computed from completed bars only (live: none). The chart keeps the 20,000 most recent triangles of each kind.
Settings
Each setting appears in the indicator's settings panel in Spectral, next to a color setting for every output.
| Setting | Type | Default | Range or options | What it does |
|---|---|---|---|---|
| Periods | Whole number | 2 | 1 – 20 | Bars on each side a fractal bar must stand out against; 2 is Williams' five-bar fractal. |
| Up fractals | On / off | On | — | Mark up fractals (swing highs) with a triangle above the bar. |
| Down fractals | On / off | On | — | Mark down fractals (swing lows) with a triangle below the bar. |
What it draws
Markers
- Up fractaltriangle up, small · above the bar
#3FB950 - Down fractaltriangle down, small · below the bar
#F85149
Source
Save it as williams-fractals-shapes.js and add it with Indicators → Custom indicators → Add file…. The format is explained in the custom indicators guide.
// Copyright (c) 2026 Spectral
// SPDX-License-Identifier: MIT-0
// Free to use, copy, modify and share: https://spectral.trade/docs/custom-indicators/LICENSE.txt
/** Spectral draws at most 20,000 markers per key: fractals go on the most recent ones. */
const MAX_FRACTALS = 20000;

/** @type {import('./spectral-indicator').IndicatorV3} */
export default {
  schemaVersion: 3,
  id: 'williams-fractals-shapes',
  name: 'Williams Fractals Shapes',
  shortName: 'Fractals',
  version: '1.0.0',
  author: 'Spectral',
  description: 'Bill Williams\' fractals as triangles: one above every swing-high bar and one below every swing-low bar, hidden while the bars are too narrow to read them.',
  pane: 'price',
  live: 'none',
  inputs: {
    periods: { type: 'integer', label: 'Periods', default: 2, min: 1, max: 20, description: 'Bars on each side a fractal bar must stand out against; 2 is Williams\' five-bar fractal.' },
    showUp: { type: 'boolean', label: 'Up fractals', default: true, description: 'Mark up fractals (swing highs) with a triangle above the bar.' },
    showDown: { type: 'boolean', label: 'Down fractals', default: true, description: 'Mark down fractals (swing lows) with a triangle below the bar.' },
  },
  markers: {
    up: { label: 'Up fractal', color: '#3FB950', shape: 'triangleUp', size: 'small', placement: 'aboveBar', hideBelowBarWidth: 2 },
    down: { label: 'Down fractal', color: '#F85149', shape: 'triangleDown', size: 'small', placement: 'belowBar', hideBelowBarWidth: 2 },
  },
  docs: {
    overview: 'Williams Fractals mark the turning points Bill Williams described in Trading Chaos (1995): an up fractal is a bar whose high is higher than the highs of the two bars before it and the two bars after it, a down fractal a bar whose low is lower than the lows of the two bars on each side. This version draws a triangle above each up fractal and below each down fractal, like TradingView\'s fractal arrows, and hides them while the bars are narrower than 2 pixels.',
    howToRead: 'Up fractals are recent swing highs, down fractals recent swing lows. In Williams\' method a break above the latest up fractal is a buy signal and a break below the latest down fractal a sell signal, usually taken only in the direction of the trend. A fractal is known only after the bars on its right have closed, so a triangle appears Periods bars after the bar it marks and never changes afterwards.',
    settings: 'Periods sets how many bars on each side must be lower (higher for a down fractal); 2 is the classic five-bar pattern, larger values mark fewer, more significant swings with more delay. Up fractals and Down fractals switch each kind; the triangle colours are appearance settings. Zoom in when the triangles are hidden.',
    notes: 'Rule (Bill Williams, Trading Chaos; TradingView, Williams Fractal: five bars, the middle one the highest high or lowest low): strict on both sides here, so a bar whose high equals a neighbour\'s is no up fractal; the built-in Williams Fractals follows TradingView\'s script, which also accepts up to four equal highs just before the fractal bar. Computed from completed bars only (live: none). The chart keeps the 20,000 most recent triangles of each kind.',
  },
  calculate(ctx) {
    const { bars, inputs } = ctx;
    const n = inputs.periods;
    const up = [];
    const down = [];
    // A fractal bar needs n completed bars on each side.
    for (let index = n; index < bars.length - n; index += 1) {
      let isUp = inputs.showUp;
      let isDown = inputs.showDown;
      for (let k = 1; k <= n && (isUp || isDown); k += 1) {
        if (bars[index - k].high >= bars[index].high || bars[index + k].high >= bars[index].high) isUp = false;
        if (bars[index - k].low <= bars[index].low || bars[index + k].low <= bars[index].low) isDown = false;
      }
      if (isUp) up.push({ index });
      if (isDown) down.push({ index });
    }
    return { markers: { up: up.slice(-MAX_FRACTALS), down: down.slice(-MAX_FRACTALS) } };
  },
};
Adapt it with an LLM
Paste this into your assistant and replace the second-to-last line with the change you want.
Start from this Spectral custom indicator: https://spectral.trade/indicators/williams-fractals-shapes.js
Format reference: https://spectral.trade/docs/custom-indicators.llm.md
Keep the file format and every rule of the reference; give the result a new id, name, shortName and version, and update docs and input descriptions to match.
Keep its live updates exact and fast (section "Fast live updates" of the reference): carry values from bar to bar only through ctx.ta, and raise live.lookback if the change reads further back; Spectral rejects a file whose live updates differ from a full recalculation or are too slow.
Change I want: <describe the change>
Answer with the complete file in one code block, ready to save as <id>.js.
Related indicators
Fair Value Gaps FVG
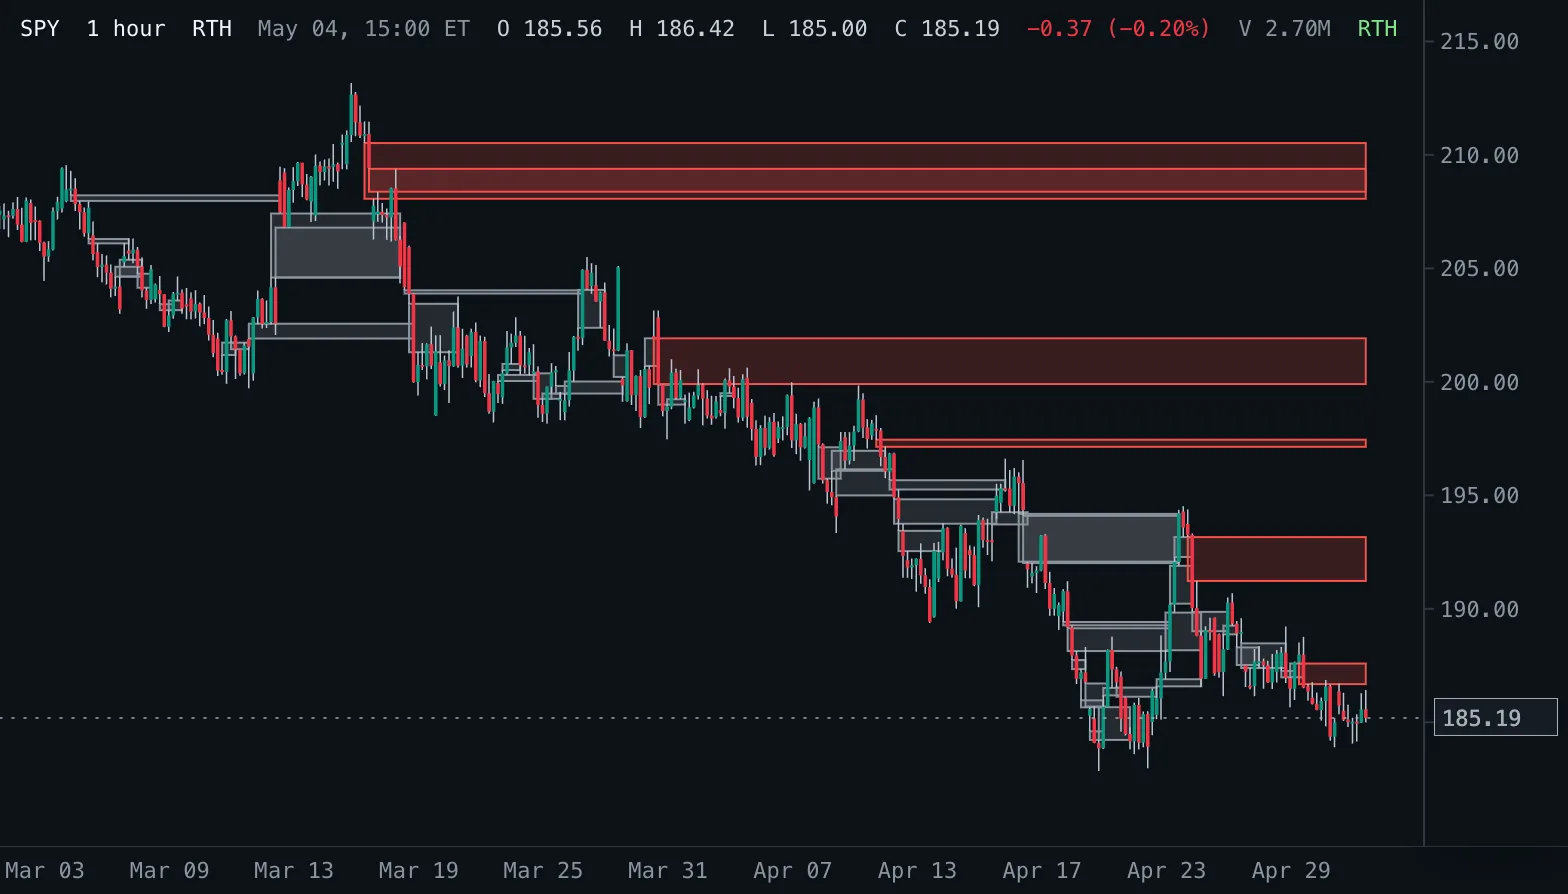
Boxes every three-bar fair value gap from its first bar until price fills (or touches) it, labelled with the gap size; hovering a box shows its size in percent and whether it is still open.
Inside Bar Breakouts IB Break
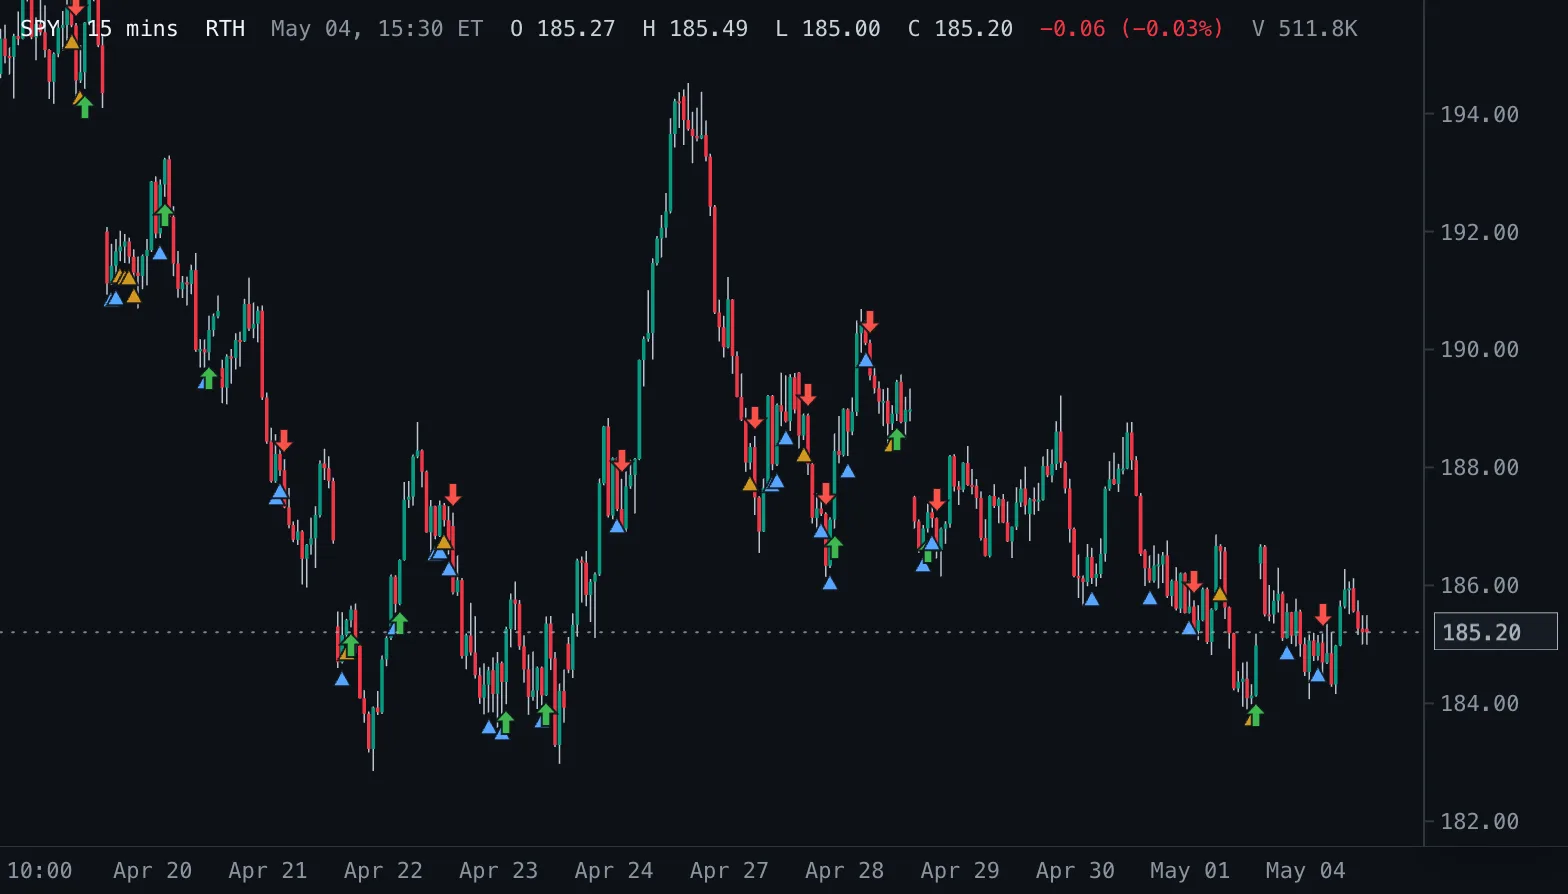
Marks inside bars with a triangle below the bar and the first close beyond the mother bar with an arrow.
Inside Bars IB
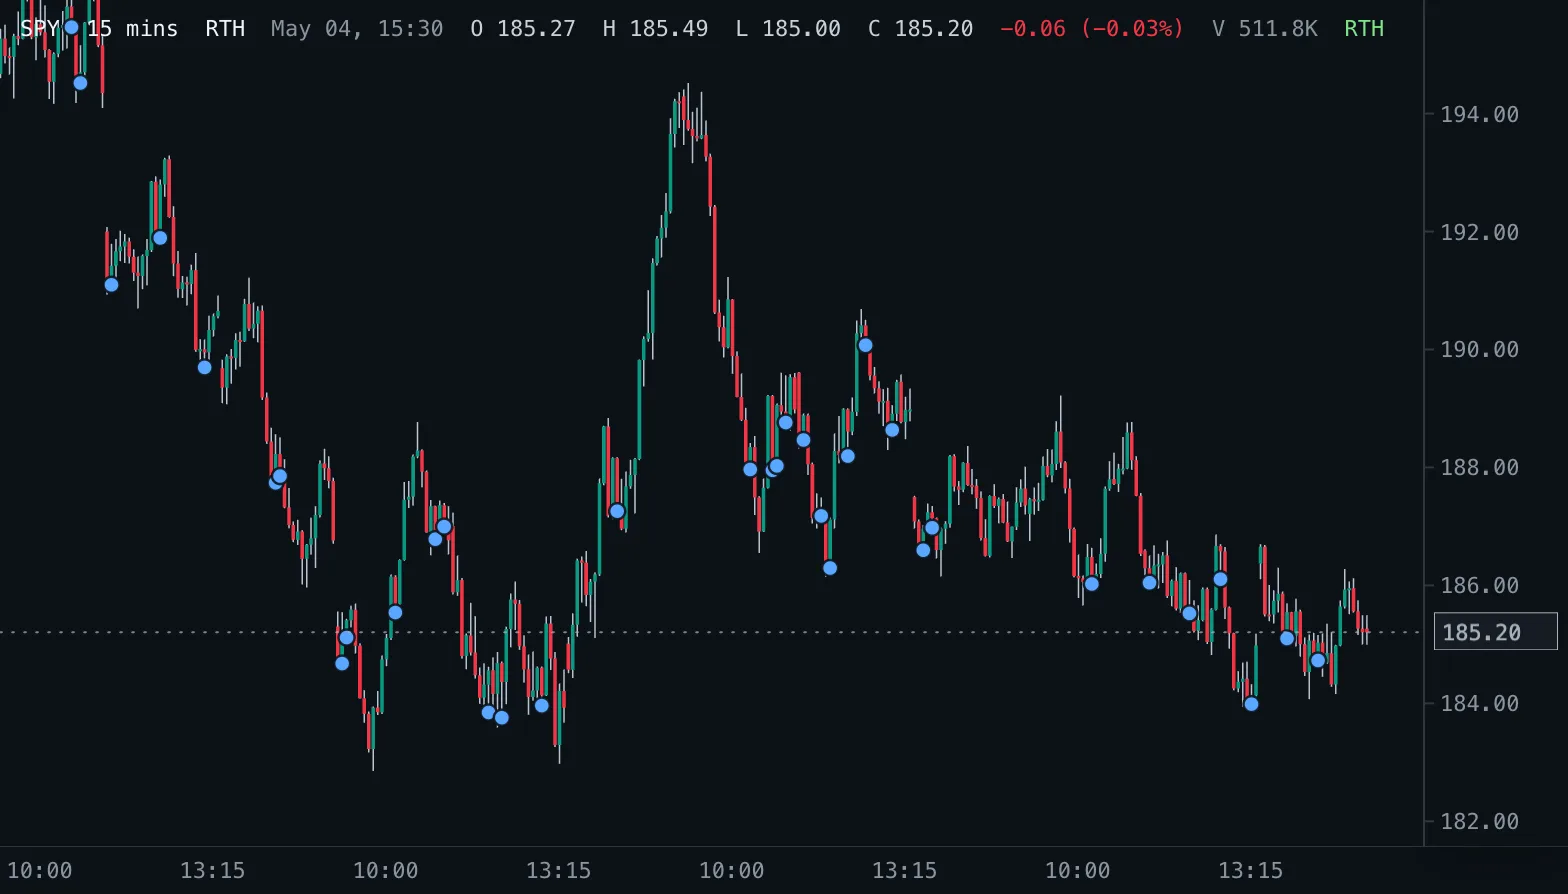
Marks completed bars whose high and low sit inside the previous bar.