Relative Strength Index
Wilder RSI on a 0-100 scale with a smoothing average and 30/50/70 reference bands.
- RSI
- Built into Spectral
- Updates every tick
- rsi
- oscillator
- overbought
- oversold
- momentum
MIT-0: free to use, change and share, no attribution needed. What you build from it is yours.
Already in Spectral: add it from the Indicators toolbox. The file here is the same indicator written as a custom indicator, to change or learn from. Installed, it appears next to the built-in one, marked Custom.
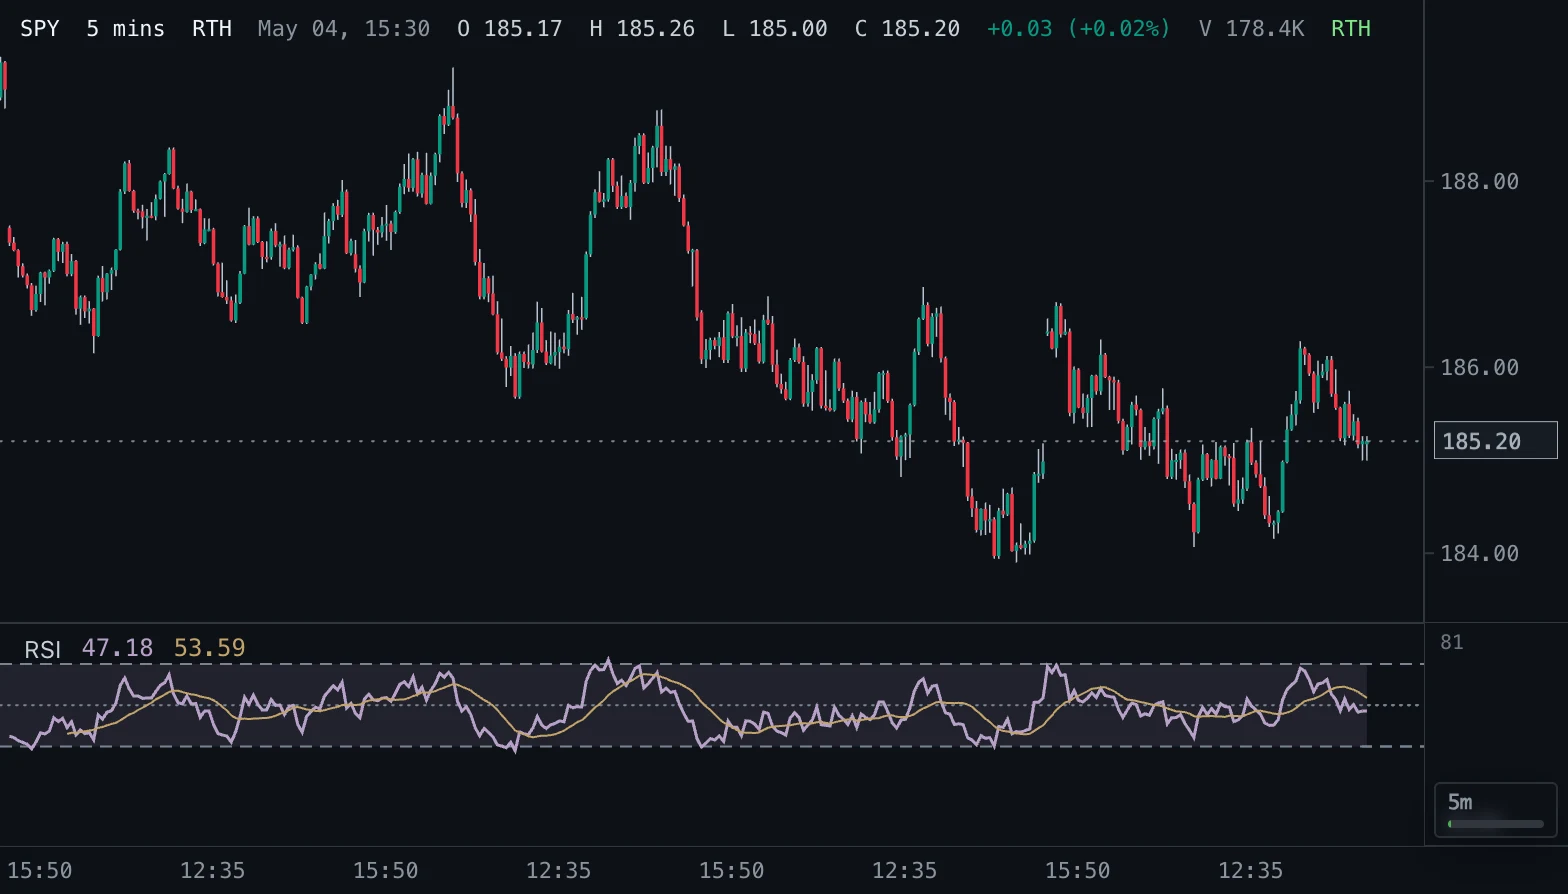
Overview
RSI measures the balance of average gains and losses over the lookback and shows it on a 0-100 scale. Gains and losses are smoothed with Wilder's method. A second line averages the RSI itself, and three reference bands mark 30, 50 and 70.
How to read it
Above 50 generally means recent gains outweigh losses; below 50 means the reverse. The 70 and 30 bands identify strong or weak momentum regimes, but an instrument can stay above 70 or below 30 during a sustained trend.
Compare reversals and divergences with price structure rather than treating a band touch as a reversal by itself. The smoothing line helps to see the RSI's own direction.
Settings and limitations
RSI length defaults to 14 bars with a 14-bar SMA smoothing line. Changing the RSI length changes responsiveness; changing the smoothing affects only the companion line. The first RSI value appears after RSI length bars.
Notes
Computes the same values as the built-in RSI in Spectral. RSI does not measure volume and says nothing about future probability on its own.
Settings
Each setting appears in the indicator's settings panel in Spectral, next to a color setting for every output.
| Setting | Type | Default | Range or options | What it does |
|---|---|---|---|---|
| RSI length | Whole number | 14 | 1 – 500 | Bars in the RSI lookback. Shorter reacts faster but is noisier. |
| Source | Price source | close | open, high, low, close, hlc3 | Price the RSI is calculated from. |
| Smoothing length | Whole number | 14 | 1 – 500 | Bars in the average drawn over the RSI line. |
| Smoothing type | Choice | SMA | SMA, EMA | Simple or exponential average for the smoothing line. |
| Upper band | Number | 70 | 0 – 100, step 1 | Level of the upper reference band. |
| Middle band | Number | 50 | 0 – 100, step 1 | Level of the middle reference band. |
| Lower band | Number | 30 | 0 – 100, step 1 | Level of the lower reference band. |
| Fill between bands | On / off | On | — | Shade the area between the upper and lower band. |
What it draws
Lines
- RSIsolid · 1.5 px · primary
#B7A1C8 - Smoothingsolid · 1 px
#C4A46A
Levels
- Upper banddashed · 1 px
#788493 - Middle banddotted · 1 px
#788493 - Lower banddashed · 1 px
#788493
Zones
- Band fillfilled at 12% opacity
#B7A1C8
Source
Save it as rsi.js and add it with Indicators → Custom indicators → Add file…. The format is explained in the custom indicators guide.
// Copyright (c) 2026 Spectral
// SPDX-License-Identifier: MIT-0
// Free to use, copy, modify and share: https://spectral.trade/docs/custom-indicators/LICENSE.txt
/** @type {import('./spectral-indicator').IndicatorV1} */
export default {
  schemaVersion: 1,
  id: 'rsi',
  name: 'Relative Strength Index',
  shortName: 'RSI',
  version: '1.0.0',
  author: 'Spectral',
  description: 'Wilder RSI on a 0-100 scale with a smoothing average and 30/50/70 reference bands.',
  pane: 'oscillator',
  live: { lookback: 0 },
  inputs: {
    length: { type: 'integer', label: 'RSI length', default: 14, min: 1, max: 500, description: 'Bars in the RSI lookback. Shorter reacts faster but is noisier.' },
    source: { type: 'source', label: 'Source', default: 'close', description: 'Price the RSI is calculated from.' },
    maLength: { type: 'integer', label: 'Smoothing length', default: 14, min: 1, max: 500, description: 'Bars in the average drawn over the RSI line.' },
    maType: { type: 'select', label: 'Smoothing type', default: 'SMA', options: ['SMA', 'EMA'], description: 'Simple or exponential average for the smoothing line.' },
    upperBand: { type: 'number', label: 'Upper band', default: 70, min: 0, max: 100, step: 1, description: 'Level of the upper reference band.' },
    middleBand: { type: 'number', label: 'Middle band', default: 50, min: 0, max: 100, step: 1, description: 'Level of the middle reference band.' },
    lowerBand: { type: 'number', label: 'Lower band', default: 30, min: 0, max: 100, step: 1, description: 'Level of the lower reference band.' },
    showFill: { type: 'boolean', label: 'Fill between bands', default: true, description: 'Shade the area between the upper and lower band.' },
  },
  plots: {
    rsi: { label: 'RSI', color: '#B7A1C8', lineWidth: 1.5, primary: true },
    ma: { label: 'Smoothing', color: '#C4A46A', lineWidth: 1 },
  },
  levels: {
    upper: { label: 'Upper band', color: '#788493', lineStyle: 'dashed' },
    middle: { label: 'Middle band', color: '#788493', lineStyle: 'dotted' },
    lower: { label: 'Lower band', color: '#788493', lineStyle: 'dashed' },
  },
  zones: {
    fill: { label: 'Band fill', color: '#B7A1C8', opacity: 0.12 },
  },
  docs: {
    overview: 'RSI measures the balance of average gains and losses over the lookback and shows it on a 0-100 scale. Gains and losses are smoothed with Wilder\'s method. A second line averages the RSI itself, and three reference bands mark 30, 50 and 70.',
    howToRead: 'Above 50 generally means recent gains outweigh losses; below 50 means the reverse. The 70 and 30 bands identify strong or weak momentum regimes, but an instrument can stay above 70 or below 30 during a sustained trend.\n\nCompare reversals and divergences with price structure rather than treating a band touch as a reversal by itself. The smoothing line helps to see the RSI\'s own direction.',
    settings: 'RSI length defaults to 14 bars with a 14-bar SMA smoothing line. Changing the RSI length changes responsiveness; changing the smoothing affects only the companion line. The first RSI value appears after RSI length bars.',
    notes: 'Computes the same values as the built-in RSI in Spectral. RSI does not measure volume and says nothing about future probability on its own.',
  },
  calculate(ctx) {
    const { bars, inputs, ta } = ctx;
    const rsi = ta.rsi(ta.source(bars, inputs.source), inputs.length);
    const ma = inputs.maType === 'EMA' ? ta.ema(rsi, inputs.maLength) : ta.sma(rsi, inputs.maLength);
    const fill = inputs.showFill
      ? { upper: bars.map(() => inputs.upperBand), lower: bars.map(() => inputs.lowerBand) }
      : { upper: bars.map(() => null), lower: bars.map(() => null) };
    return {
      plots: { rsi, ma },
      levels: { upper: inputs.upperBand, middle: inputs.middleBand, lower: inputs.lowerBand },
      zones: { fill },
    };
  },
};
Adapt it with an LLM
Paste this into your assistant and replace the second-to-last line with the change you want.
Start from this Spectral custom indicator: https://spectral.trade/indicators/rsi.js
Format reference: https://spectral.trade/docs/custom-indicators.llm.md
Keep the file format and every rule of the reference; give the result a new id, name, shortName and version, and update docs and input descriptions to match.
Keep its live updates exact and fast (section "Fast live updates" of the reference): carry values from bar to bar only through ctx.ta, and raise live.lookback if the change reads further back; Spectral rejects a file whose live updates differ from a full recalculation or are too slow.
Change I want: <describe the change>
Answer with the complete file in one code block, ready to save as <id>.js.
Related indicators
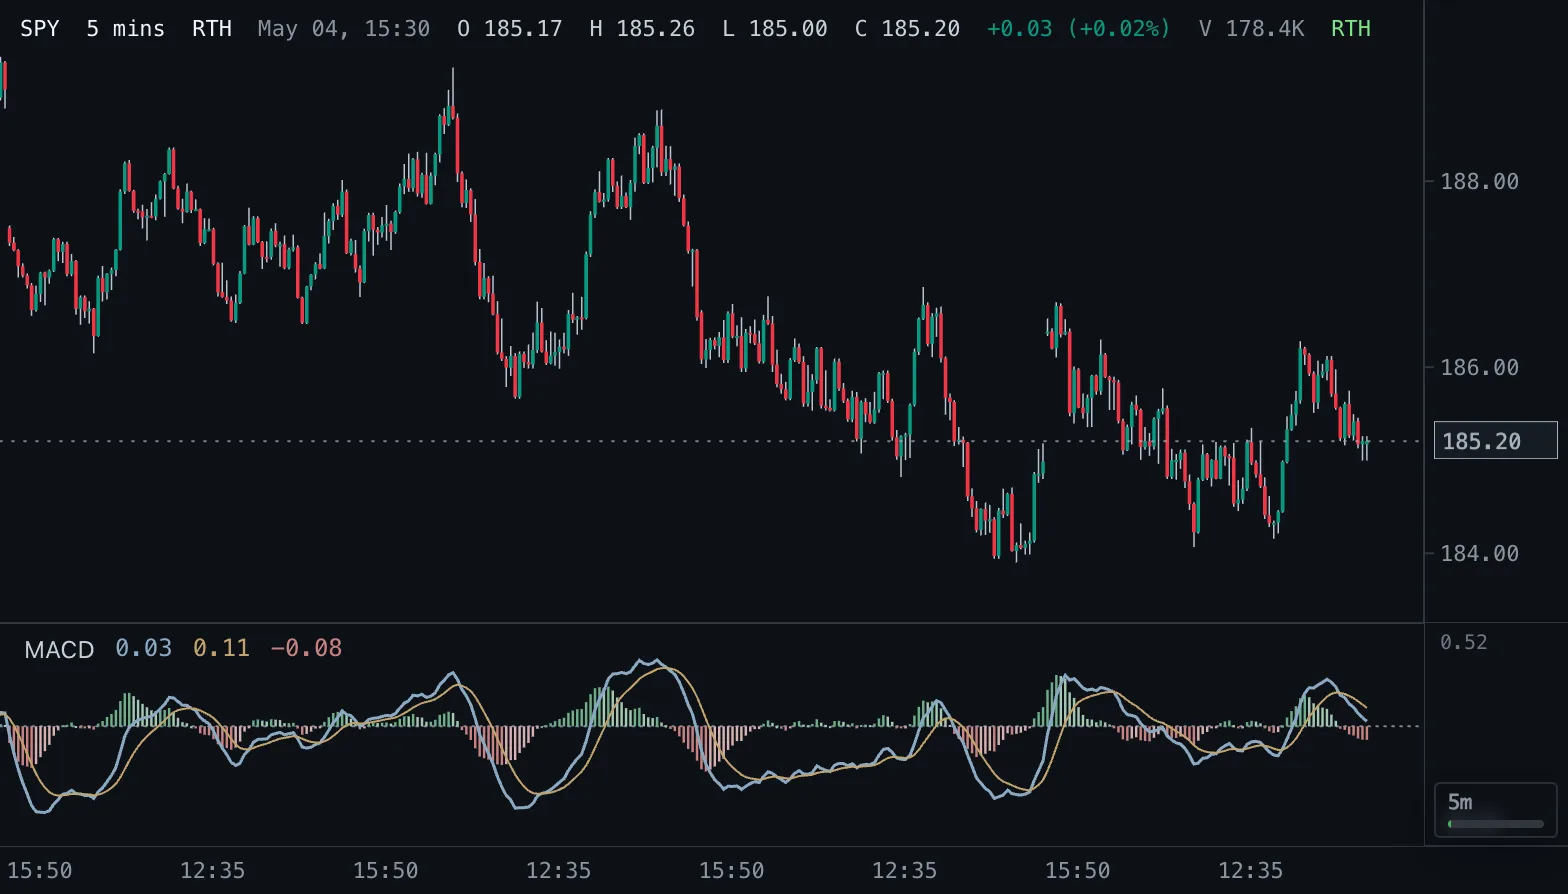
Moving Average Convergence Divergence MACD
MACD line, signal line and a four-color histogram that shows whether momentum is rising or falling.
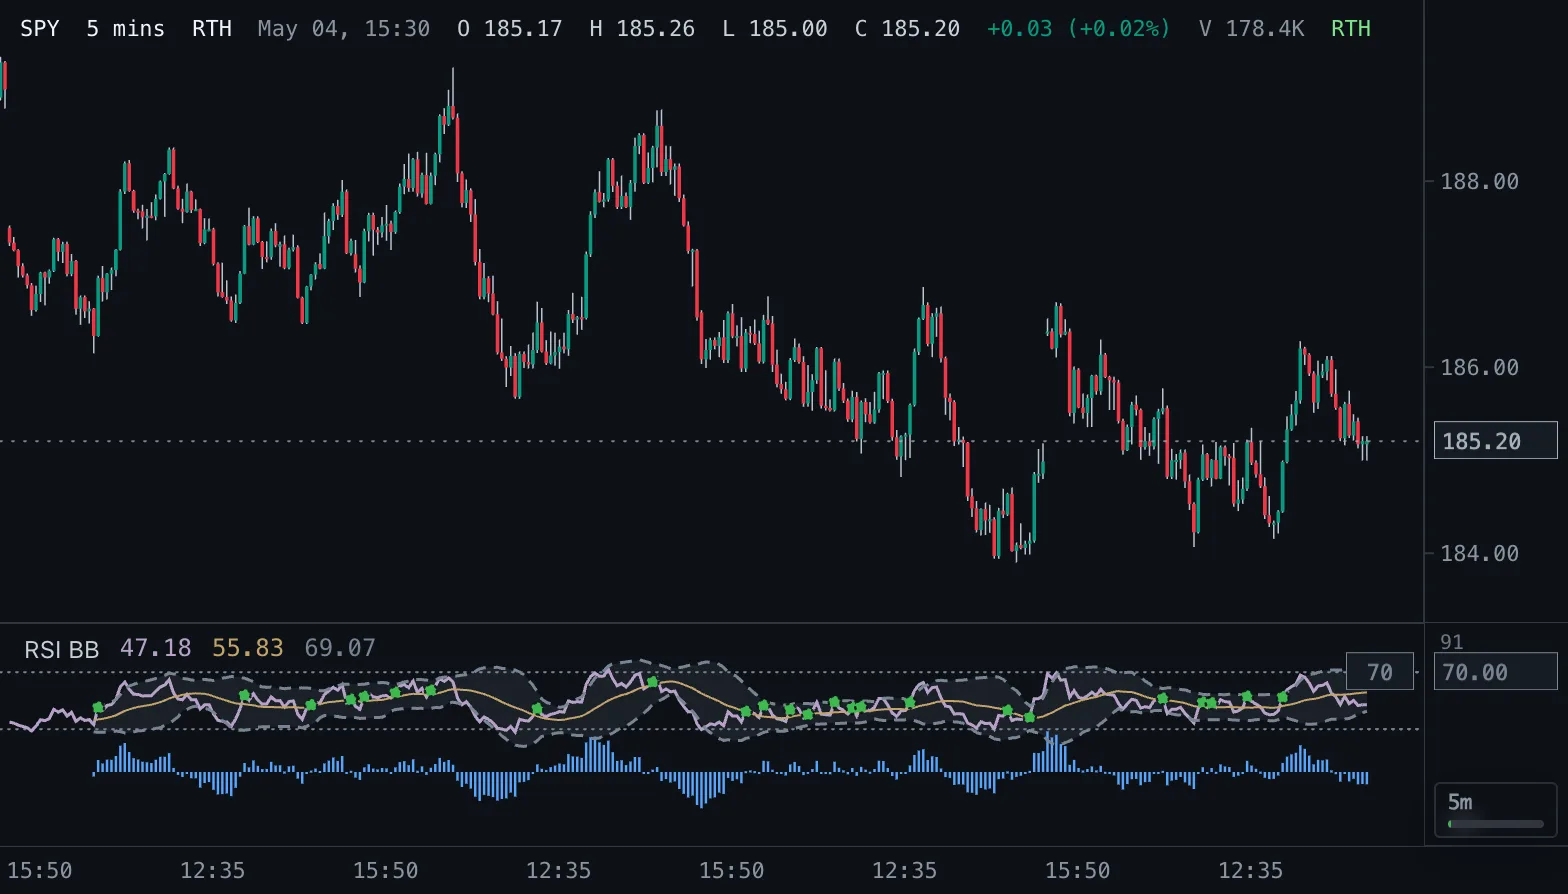
RSI with Bollinger Bands RSI BB
RSI with a Bollinger envelope around its moving average, 30/70 guides and crossover dots.
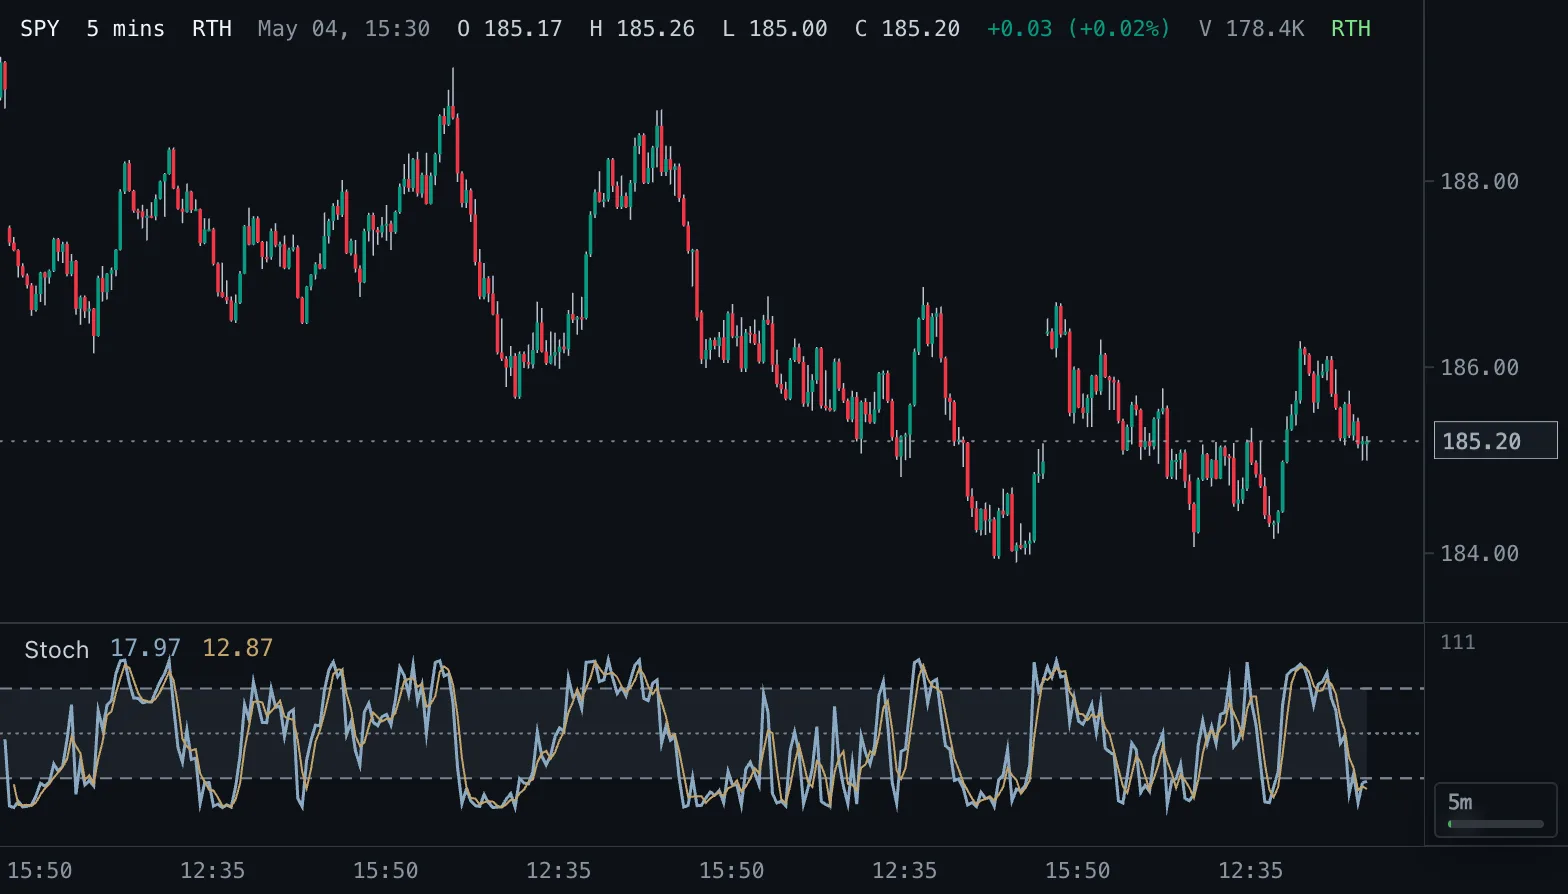
Stochastic Oscillator Stoch
Where the close sits inside the recent high-low range, on a 0-100 scale, with %K, a %D signal line and 80/20 bands.